


N5 Net Software Repository
Your one-stop for all your software needs.
Search N5 Net Software Repository:
Search Files
Sponsor:
Browse:
- Audio & Multimedia (3039)
- Business (5565)
- Communications (1642)
- Desktop (531)
- Development (1260)
- Education (505)
- Games & Entertainment (1131)
- Graphic Apps (1290)
- Home & Hobby (269)
- Network & Internet (1005)
- Security & Privacy (1246)
- Servers (129)
- System Utilities (32725)
- Web Development (518)
Areas Of Interest
Authors Area
Are you a software author? Take a look at our Author Resource Center where you will find marketing tools, software specifically created for promoting your software and a ton of other helpful resources.
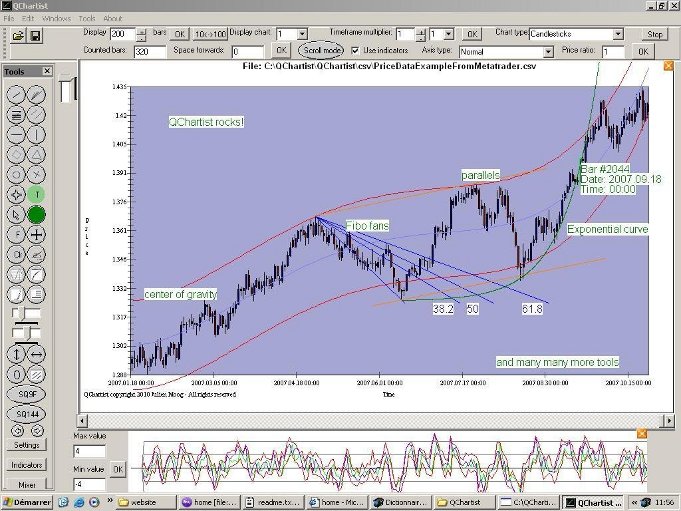
QChartist 51
(Click to Enlarge)
QChartist is a free charting software to do technical analysis on any data like Forex, Stocks. It helps to make market forecasts with the help of technical objects and indicators. You can draw geometrical shapes on your charts or plot programmable indicators from your data. It is also possible to filter or merge data. It has built-in astro indicators and realtime quotes. It is fairly easy to port programmed indicators from MT4 to QChartist. It is now faster and much more professional thanks to the use of a C++ layer (used mostly for calculations) over the standard Basic layer (used mostly for the GUI interface). You can display charts by importing csv files. You can change the timeframe multiplier. You can use a logarithmic axis type. You can display polar chart type. You can draw indicators on your charts and create new ones. You can create exotic pairs with the mixer tool. You can build automated analysis and get signals with alerts. Integrated third party trading platform for market orders execution. And many more features...
Specifications:
Version: 51 |
Download
|

Similar Products:
Business :: Accounting & Finance
QChartist is a free charting software to do technical analysis on any data like Forex, Stocks. It helps to make market forecasts with the help of technical objects and indicators. You can draw geometrical shapes on your charts or plot programmable indicators from your data. It is also possible to filter or merge data. It has built-in astro indicators and realtime quotes.
Windows | Freeware
Read More
Business :: Accounting & Finance
 Ashkon Stock Watch is an advanced charting software for stock market traders. Unlike a conventional financial website it allows to display several technical indicators for a single market security on the same chart, open multiple chart documents, maintain predefined lists of securities and test your own investment strategies by placing virtual Buys and Sells on a chart. Charting stocks listed at international stock exchanges is supported.
Windows | Shareware
Read More
Business :: Investment Tools
 MayaTrader is Number 1 Charting & Trading Signals System tools for both beginners and advanced traders. When it comes to analysis and creating technical strategies, the tool is extremely useful for user to make the informed decisions. We cover 15 Markets, from US, UK, CANADA, GERMANY, INDIA, AUSTRALIA,FOREX,FUTURES,CRYPTO.
Windows | Shareware
Read More
MODULUSFE MODULUS STOCKCHARTX 5.8
Development :: Basic, VB, VB DotNet
 For .NET, VB6, C++ and other languages: StockChartX is a component that can import raw stock data, display it graphically, embed chart objects, and save/load in XML file format. Includes OHLC, Candlesticks, Renko, Kagi, Three Line Break, Point & Figure, Candlevolume, Equivolume, Shaded Equivolume, Darvas Boxes, plus over 150 technical analisys indicators, and line studies including Speed Lines, Gan Fans, Fibonacci and so much more!
Windows MAC Linux | Commercial
Read More