


N5 Net Software Repository
Your one-stop for all your software needs.
Search N5 Net Software Repository:
Search Files
Sponsor:
Browse:
- Audio & Multimedia (1527)
- Business (1697)
- Communications (462)
- Desktop (135)
- Development (555)
- Education (163)
- Games & Entertainment (700)
- Graphic Apps (657)
- Home & Hobby (102)
- Network & Internet (524)
- Security & Privacy (499)
- Servers (65)
- System Utilities (8668)
- Web Development (279)
Areas Of Interest
Authors Area
Are you a software author? Take a look at our Author Resource Center where you will find marketing tools, software specifically created for promoting your software and a ton of other helpful resources.
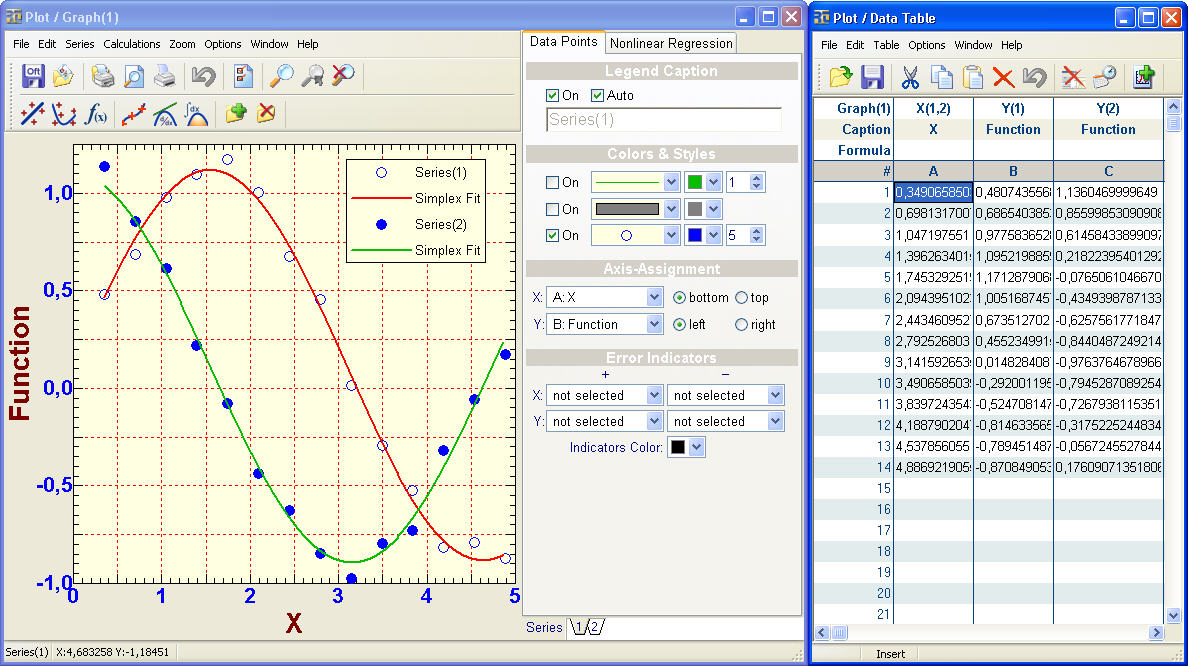
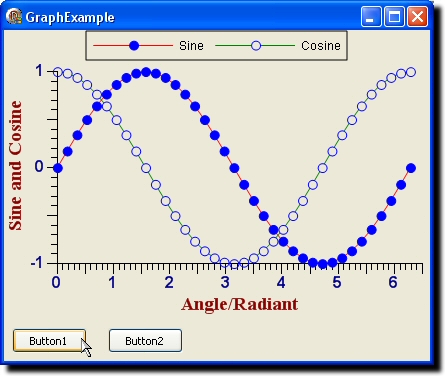
Rt-Plot 2.8.10.83
(Click to Enlarge)
Rt-Plot is a tool to generate Cartesian X/Y-plots from scientific data. You can enter and calculate tabular data. View the changing graphs, including linear and non linear regression, interpolation, differentiation and integration, during entering. Rt-Plot enables you to create plots fast and easily. The line calculations give full access to calculation and display ranges and can use statistical weights. The options can be changed interactively. A powerful reporting module generates ready to publish documents. The result on the screen is the same as on the report printout (what you see is what you get). Although the program looks simple, the graph can be altered in any item you can imagine. All distances in axis, scaling, numberings, captions colors, line- and point styles and colors can be altered. Thus a plot can be generated fitting the requirements of any journal you want to publish in and of cause your personal taste. Features: unlimited number of data points, live calculated data points in data table, unlimited number of graphs, unlimited number of series in graph, unlimited number of calculated lines, linear regression, polynomial, non linear regression,interpolation, smoothing, differential, integral, calculations can use statistical weights, error indicators at data points, function interpreter for calculating columns and non linear functions, graph fully customizable, secondary axis at top and right, twisted, log, exponential axis scaling, all distances colors styles can be varied, report fully customizable, built in word processor, including graph and results.
Specifications:
Version: 2.8.10.83 |
Download
|

Similar Products:
Development :: Components & Libraries
 DISLIN is a high-level and easy to use plotting library for displaying data as curves, bar graphs, pie charts, 3D-colour plots, surfaces, contours and maps. Several output formats are supported such as X11, VGA, PostScript, PDF, CGM, SVG, PNG and TIFF. DISLIN is available for the programming languages Fortran 77, Fortran 90 and C. Plotting extensions for the languages Perl, Python and Java are also supported for the most operating systems.
Windows | Shareware
Read More
Business :: Math & Scientific Tools
 3D Grapher is a feature-rich yet easy-to-use graph plotting and data visualization software suitable for students, engineers and everybody who needs to work with 2D and 3D graphs. With 3D Grapher you can easily plot the equation and table-based graphs, zoom them, rotate, view at any angle and even animate. You can draw the unlimited number of graphs in one coordinate system to visualize and analyze the domains of functions and their intercepts.
Windows | Shareware
Read More
RT-SCIENCE TOOLS2D FOR DELPHI 3.3.2.29
Development :: Delphi
 The selection of components to generate two dimensional Cartesian plots with: unlimited number of axis (secondary axis) manifold options for scaling, grids, legends, automatic scaling, automatic zooming, unlimited number of series, manifold line and point styles, calculated Regression Lines, Interpolation, Differential and Integral, supporting components for editing and styles selection
Windows | Shareware
Read More