


N5 Net Software Repository
Your one-stop for all your software needs.
Search N5 Net Software Repository:
Search Files
Sponsor:
Browse:
- Audio & Multimedia (3039)
- Business (5565)
- Communications (1642)
- Desktop (531)
- Development (1260)
- Education (505)
- Games & Entertainment (1131)
- Graphic Apps (1290)
- Home & Hobby (269)
- Network & Internet (1005)
- Security & Privacy (1246)
- Servers (129)
- System Utilities (32725)
- Web Development (518)
Areas Of Interest
Authors Area
Are you a software author? Take a look at our Author Resource Center where you will find marketing tools, software specifically created for promoting your software and a ton of other helpful resources.
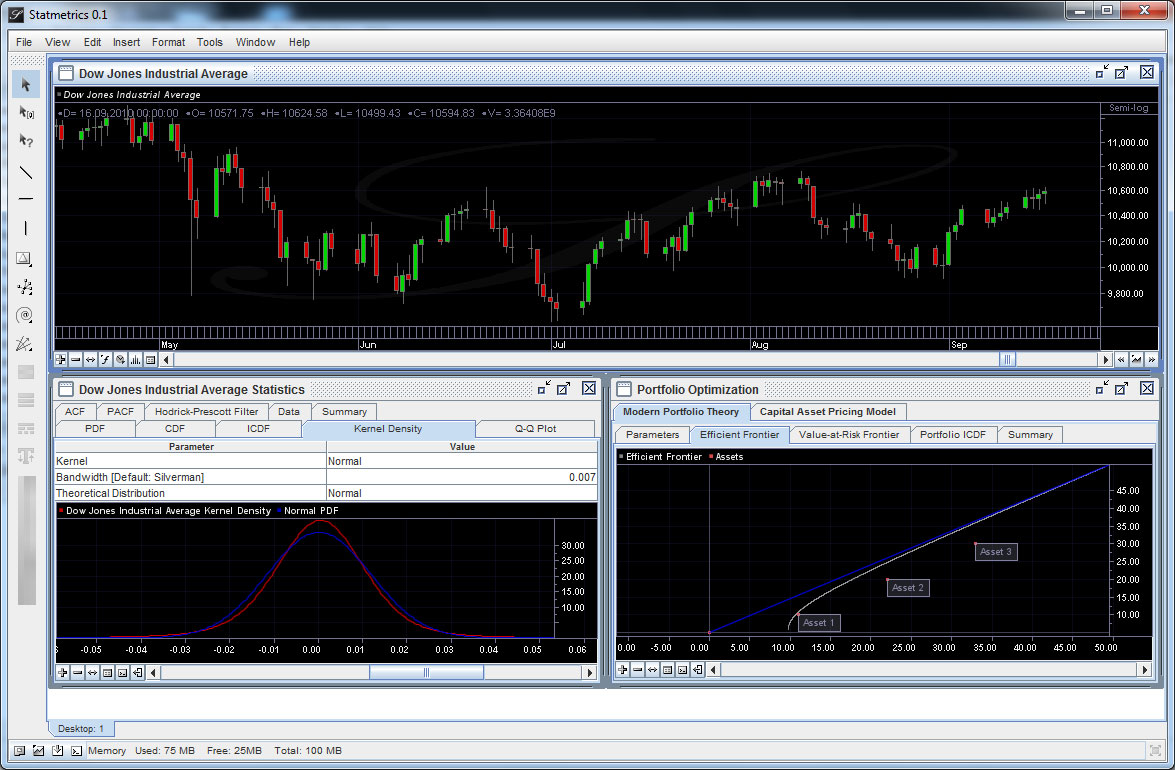
Statmetrics 0.1
(Click to Enlarge)
Statmetrics is a free cross-platform software application providing an interactive environment for computational finance. Statmetrics combines innovative quantitative finance technologies with traditional technical and econometric analysis methods. Statmetrics can be used in diverse fields to perform econometric analysis, technical analysis, risk management, portfolio management and asset allocation. Statmetrics Major Features: Technical Charting: - Intuitive charting technology - Dynamic chart scaling - Fast zooming and live scrolling - Time-series compression - Intelligent drawing tools - Interface customization - Charting window management Technical Analysis: - Built-in technical indicators - Custom technical indicators - Trading signals - Multiple data-source support Numerical Analysis: - 2D and 3D visualization - Special functions - Linear algebra - Equation solving - Numerical calculus Econometric Analysis: - Statistical analysis - Statistical visualization - Statistical tests - Time series analysis Quantitative Financial Models: - Modern portfolio theory - Capital asset pricing model - Black-Scholes Model Programming: - Powerful Script editor - Groovy based scripting language - Importing java classes and packages - Accessing external java libraries Finance Data Providers: - Yahoo! Finance - Google Finance - German Federal Bank - European Central Bank Data Management: - External data import/export - Data hibernation - Data editing - Automatic data download
Specifications:
Version: 0.1 |
Download
|

Similar Products:
DICTIONARY TECHNICAL ENGLISH GERMAN 3.0
Business :: Databases & Tools
 For Companies with own applications: Technical Dictionaries, Thesauruses and Verb Conjugations for English French, Spanish, German, Portuguese, Brazilian, Italian, Swedish and Dutch. Databases in Excel, MS- ACCESS or SQL format. Integrate it into your application, website, search engine. For Universities, translation agencies (create a basis for your own Translation Memories -TM) , companies with own applications, scientific departments
Windows MAC Linux | Data Only
Read More
TECHNICAL DICTIONARY ENGLISH DUTCH 3.0
Business :: Databases & Tools
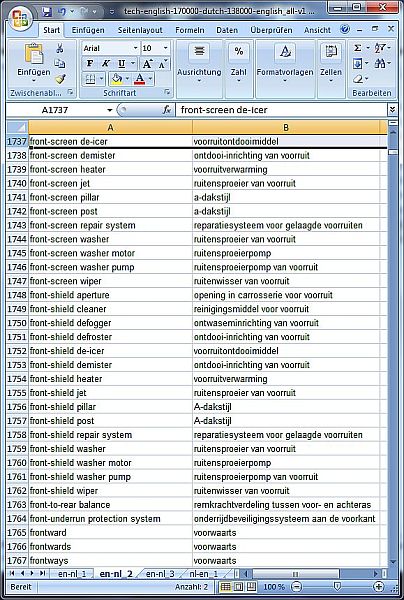 For Companies with own applications: Technical Dictionaries, Thesauruses and Verb Conjugations for English French, Spanish, German, Portuguese, Brazilian, Italian, Swedish and Dutch. Databases in Excel, MS- ACCESS or SQL format. Integrate it into your application, website, search engine. For Universities, translation agencies (create a basis for your own Translation Memories -TM) , companies with own applications, scientific departments
Windows MAC Linux | Data Only
Read More
MODULUSFE MODULUS STOCKCHARTX 5.8
Development :: Basic, VB, VB DotNet
 For .NET, VB6, C++ and other languages: StockChartX is a component that can import raw stock data, display it graphically, embed chart objects, and save/load in XML file format. Includes OHLC, Candlesticks, Renko, Kagi, Three Line Break, Point & Figure, Candlevolume, Equivolume, Shaded Equivolume, Darvas Boxes, plus over 150 technical analisys indicators, and line studies including Speed Lines, Gan Fans, Fibonacci and so much more!
Windows MAC Linux | Commercial
Read More
Development :: Basic, VB, VB DotNet
For .NET, VB6, C++ and other languages: StockChartX is a component that can import raw stock data, display it graphically, embed chart objects, and save/load in XML file format. Includes OHLC, Candlesticks, Renko, Kagi, Three Line Break, Point & Figure, Candlevolume, Equivolume, Shaded Equivolume, Darvas Boxes, plus over 150 technical analisys indicators, and line studies including Speed Lines, Gan Fans, Fibonacci and so much more!
Windows MAC Linux | Commercial
Read More