


N5 Net Software Repository
Your one-stop for all your software needs.
Search N5 Net Software Repository:
Search Files
Sponsor:
Browse:
- Audio & Multimedia (1527)
- Business (1697)
- Communications (462)
- Desktop (135)
- Development (555)
- Education (163)
- Games & Entertainment (700)
- Graphic Apps (657)
- Home & Hobby (102)
- Network & Internet (524)
- Security & Privacy (499)
- Servers (65)
- System Utilities (8668)
- Web Development (279)
Areas Of Interest
Authors Area
Are you a software author? Take a look at our Author Resource Center where you will find marketing tools, software specifically created for promoting your software and a ton of other helpful resources.
Search: visualization
Business :: Math & Scientific Tools
 3D Grapher is a feature-rich yet easy-to-use graph plotting and data visualization software suitable for students, engineers and everybody who needs to work with 2D and 3D graphs. With 3D Grapher you can easily plot the equation and table-based graphs, zoom them, rotate, view at any angle and even animate. You can draw the unlimited number of graphs in one coordinate system to visualize and analyze the domains of functions and their intercepts.
Windows | Shareware
Read More | Download Now
Audio & Multimedia :: Presentation Tools
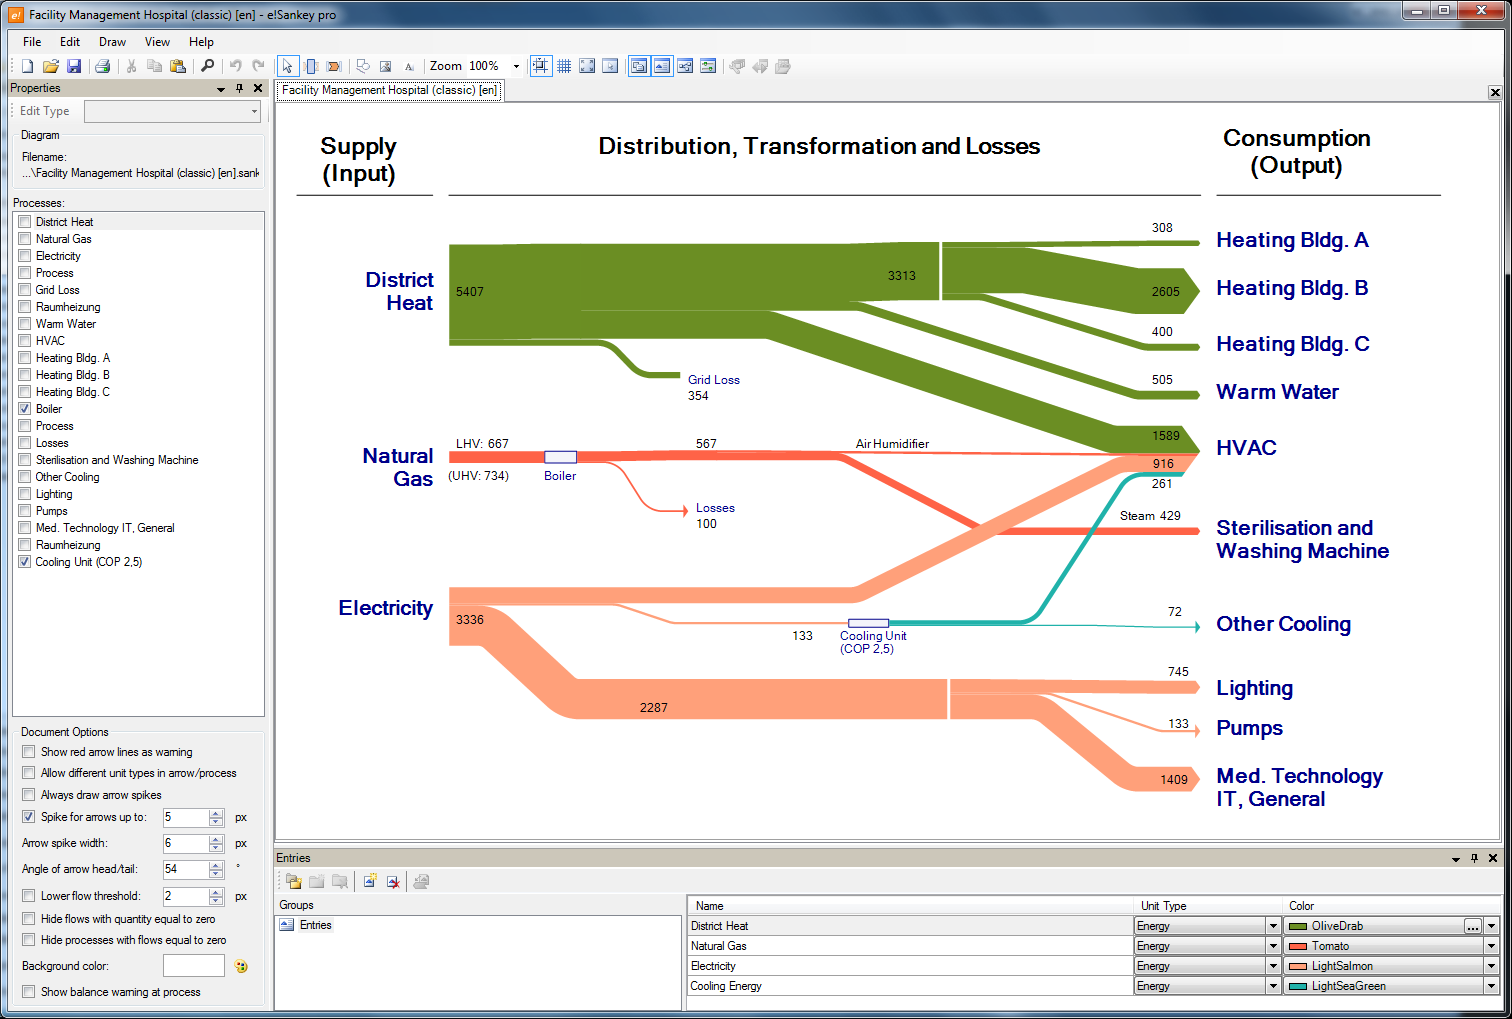 A software to easily create Sankey diagrams. A Sankey diagram is a directional flow chart where the width of the arrows is proportional to the flow quantity. Sankey diagrams are a useful way of visualizing material flows, energy or costs. If you are a chemical, environmental or process engineer, a professional in quality management, logistics or finance, you can use e!Sankey diagrams to display flow quantities in production systems.
Windows | Shareware
Read More | Download Now
Audio & Multimedia :: Presentation Tools
A software to easily create Sankey diagrams. A Sankey diagram is a directional flow chart where the width of the arrows is proportional to the flow quantity. Sankey diagrams are a useful way of visualizing material flows, energy or costs. If you are a chemical, environmental or process engineer, a professional in quality management, logistics or finance, you can use e!Sankey diagrams to display flow quantities in production systems. Excel import.
Windows | Shareware
Read More | Download Now
E-XD++ BPMN VISUALIZATION COMPONENT 25.01
Development :: Components & Libraries
 Ready to use software component with 100% Source Codes!
UCanCode provides ready-to-use software components for building the displays needed for business process modeling and business activity monitoring (BAM). These products are available for both the VC++ and .NET platforms.
Ready to use software component with 100% Source Codes!
UCanCode provides ready-to-use software components for building the displays needed for business process modeling and business activity monitoring (BAM). These products are available for both the VC++ and .NET platforms.
Windows | Demo
Read More | Download Now
HMI-SCADA GRAPHICS VISUALIZATION 25.0
Development :: Components & Libraries
 "UCanCode Software Inc. is a leading provider of HMI & SCADA, CAD, UML, GIS and Data Visualization Graphics for software developers more than 40 countries around the world!"
Windows | Demo
Read More | Download Now
Graphic Apps :: Converters & Optimizers
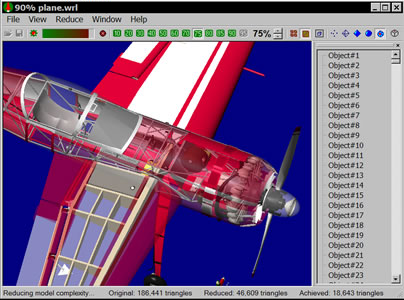 Low.3D Studio is designed specially for game developers, architects, and 3D designers. With this software in place, they get a pain-free way to reduce polygons and optimize 3D models, and presentations before publishing them on Web. Supports Wavefront .OBJ and StereoLitho (.STL) file formats.
Windows | Demo
Read More | Download Now
MINDFUSION.CHARTING FOR ASP.NET 3.4
Development :: Components & Libraries
 Easy to use charting controls for ASP.NET applications. The package includes Graph, Line, Area, Bar, Polar, Radar and Pie Chart components. Each of them can be fully customized via the hundreds properties and methods exposed. All controls support data-binding for fast database reports. Data for visualization can be also provided programmatically. MindFusion.Charting is royalty free for client and server side use. 12 month upgrade subscription.
Windows | Commercial
Read More | Download Now
MINDFUSION.CHARTING FOR WPF 2.0
Development :: Components & Libraries
Easy to use .NET gauge and charting controls for WPF applications. The package includes Graph, Line, Area, Surface, Bar, Radar and Pie chart components (in 2D and 3D) and Oval and Linear gauges. Each of them can be fully customized via the hundreds properties and methods exposed. All controls support data-binding for fast database reports. Data for visualization can be also provided programmatically. MindFusion.Charting is royalty free.
Windows | Commercial
Read More | Download Now
::
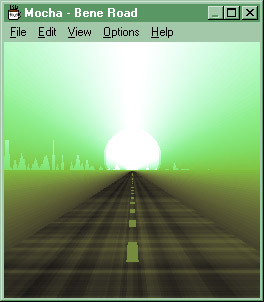 Mocha allows you to generate shifting sound responsive images. Starting with a simple mathematical expression called a bene, a mix of gene and bean, pronounced "bean", you can investigate the visual impact of variable time, the inflence of sounds, colors, and seed images to the images created by Mocha. Evolve your visualizations purposfully, exploring th effects of various changes to the bene.. Watch as images evolve organically.
Windows | Freeware
Read More | Download Now
Network & Internet :: Network Monitoring
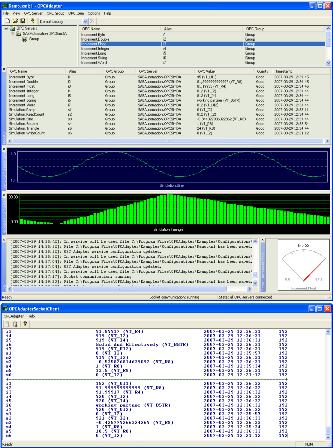 OPC client after the specifications DA 3.0, 2.05, 1.0 enabling TCP/IP tunneling to local or networked applications over computer domains, over Internet and over operating system platforms using proprietary easy and well described protocol, very easy configurable trending, displaying and own activity logging. Configuration of OPC Client groups as well as visualization is saved in XML configuration file. Windows Service without UI included.
Windows | Shareware
Read More | Download Now
Development :: Components & Libraries
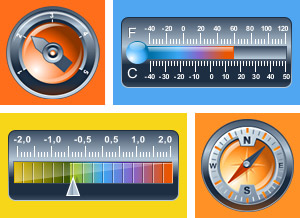 Perfect Widgets is a HTML5 (JavaScript) component including 150+ pre-designed gauges that are ready to be inserted into a web page. The product offers gauge designer where developers can edit existing gauges or create them from scratch and then convert gauges to JSON format for further use. The gauge can also be set using declarative selection of the parameter in JSON. Perfect Widgets can be used on: ASP, ASP.NET, PHP, JSP, ColdFusion, etc.
Windows | Shareware
Read More | Download Now
[1]