


N5 Net Software Repository
Your one-stop for all your software needs.
Search N5 Net Software Repository:
Search Files
Sponsor:
Browse:
- Audio & Multimedia (1527)
- Business (1697)
- Communications (462)
- Desktop (135)
- Development (555)
- Education (163)
- Games & Entertainment (700)
- Graphic Apps (657)
- Home & Hobby (102)
- Network & Internet (524)
- Security & Privacy (499)
- Servers (65)
- System Utilities (8668)
- Web Development (279)
Areas Of Interest
Authors Area
Are you a software author? Take a look at our Author Resource Center where you will find marketing tools, software specifically created for promoting your software and a ton of other helpful resources.
Downloading Rt-Plot 2.8.10.83
Your download will begin in a few seconds. If it does not start you can download directly through one of the mirror sites below.
- Mirror Site 1: http://www.rt-science.de/downloads/Rt-Plot_setup.exe
Get Details for Rt-Plot 2.8.10.83
Similar Products:
Development :: Components & Libraries
 DISLIN is a high-level and easy to use plotting library for displaying data as curves, bar graphs, pie charts, 3D-colour plots, surfaces, contours and maps. Several output formats are supported such as X11, VGA, PostScript, PDF, CGM, SVG, PNG and TIFF. DISLIN is available for the programming languages Fortran 77, Fortran 90 and C. Plotting extensions for the languages Perl, Python and Java are also supported for the most operating systems.
Windows | Shareware
Read More
Business :: Math & Scientific Tools
 3D Grapher is a feature-rich yet easy-to-use graph plotting and data visualization software suitable for students, engineers and everybody who needs to work with 2D and 3D graphs. With 3D Grapher you can easily plot the equation and table-based graphs, zoom them, rotate, view at any angle and even animate. You can draw the unlimited number of graphs in one coordinate system to visualize and analyze the domains of functions and their intercepts.
Windows | Shareware
Read More
RT-SCIENCE TOOLS2D FOR DELPHI 3.3.2.29
Development :: Delphi
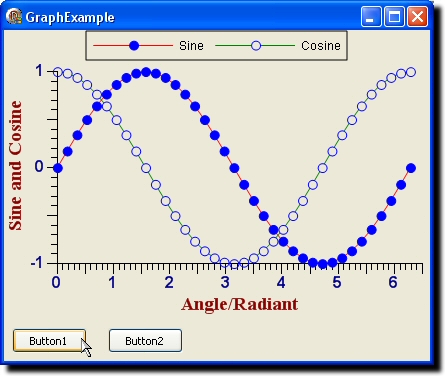 The selection of components to generate two dimensional Cartesian plots with: unlimited number of axis (secondary axis) manifold options for scaling, grids, legends, automatic scaling, automatic zooming, unlimited number of series, manifold line and point styles, calculated Regression Lines, Interpolation, Differential and Integral, supporting components for editing and styles selection
Windows | Shareware
Read More
Home & Hobby :: Personal Finance
 CharTTool is stock charting software. In addition to charting US and international stocks you may chart historical currency exchange rates, mutual funds and market indices. Intraday and end-of-day stock charting is supported. The list of technical indicators includes Bollinger bands, price channels, moving averages, fast and slow stochastic oscillators, RSI, MACD, trading volume and others. International stock exchanges are supported.
Windows | Shareware
Read More
Education :: Mathematics
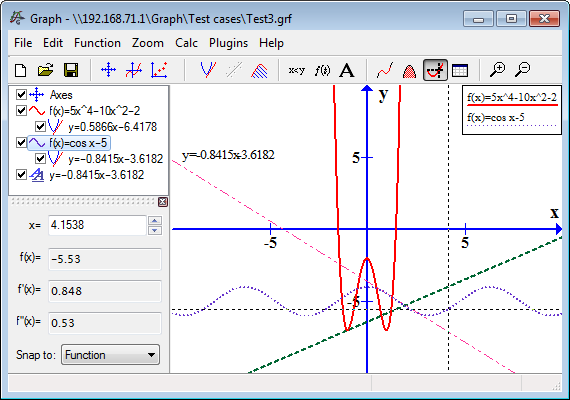 This program is for drawing graphs of mathematical functions in a coordinate system. Graphs may be added with different color and line styles. The program supports standard, parameter and polar functions. It is possible to evaluate a function at an entered point or tracing the function with the mouse. It is possible to add shadings to functions, and series of points to the coordinate system. Trendlines may be added to point series.
Windows | Freeware
Read More
Development :: Source Editors
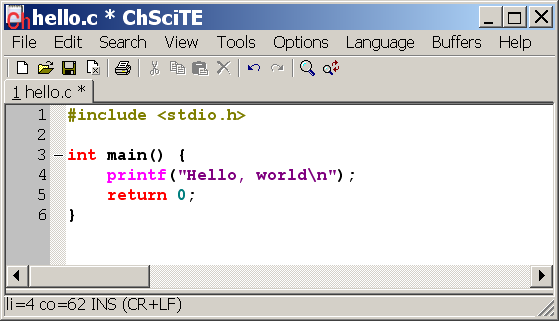 ChSciTE is a Ch IDE (Integrated Development Environment ) to edit and run C, Ch and C++ programs. Ch is an embeddable C/C++ interpreter for cross-platform scripting, shell programming, 2D/3D plotting, numerical computing and embedded scripting. It supports international languages and is an open source IDE. It can compiled and run across platform.
Windows MAC Linux | Freeware
Read More
VERYPDF PCL CONVERTER (PCL TO PDF) 2.02
::
 VeryPDF PCL Converter quickly converts PCL and PXL print files to Adobe Acrobat PDF files as well as TIF, TIFF, JPG, JPEG, BMP, PCX, PXL files. This is not a raster based conversion. VeryPDF PCL Converter can be used to create either bitmap files (PCX, TIF, JPEG, BMP etc.) at various resolutions or searchable PDF files.
VeryPDF PCL Converter is the fastest and most accurate converter of PCL, PXL, PX3 to PDF, TIFF and other distribution formats.
VeryPDF PCL Converter quickly converts PCL and PXL print files to Adobe Acrobat PDF files as well as TIF, TIFF, JPG, JPEG, BMP, PCX, PXL files. This is not a raster based conversion. VeryPDF PCL Converter can be used to create either bitmap files (PCX, TIF, JPEG, BMP etc.) at various resolutions or searchable PDF files.
VeryPDF PCL Converter is the fastest and most accurate converter of PCL, PXL, PX3 to PDF, TIFF and other distribution formats.
Windows | Shareware
Read More