


N5 Net Software Repository
Your one-stop for all your software needs.
Search N5 Net Software Repository:
Search Files
Sponsor:
Browse:
- Audio & Multimedia (1566)
- Business (1738)
- Communications (472)
- Desktop (180)
- Development (573)
- Education (166)
- Games & Entertainment (709)
- Graphic Apps (679)
- Home & Hobby (105)
- Network & Internet (543)
- Security & Privacy (503)
- Servers (64)
- System Utilities (9409)
- Web Development (284)
Areas Of Interest
Authors Area
Are you a software author? Take a look at our Author Resource Center where you will find marketing tools, software specifically created for promoting your software and a ton of other helpful resources.
Stock Spy - RSS Stock News Charts 1.37
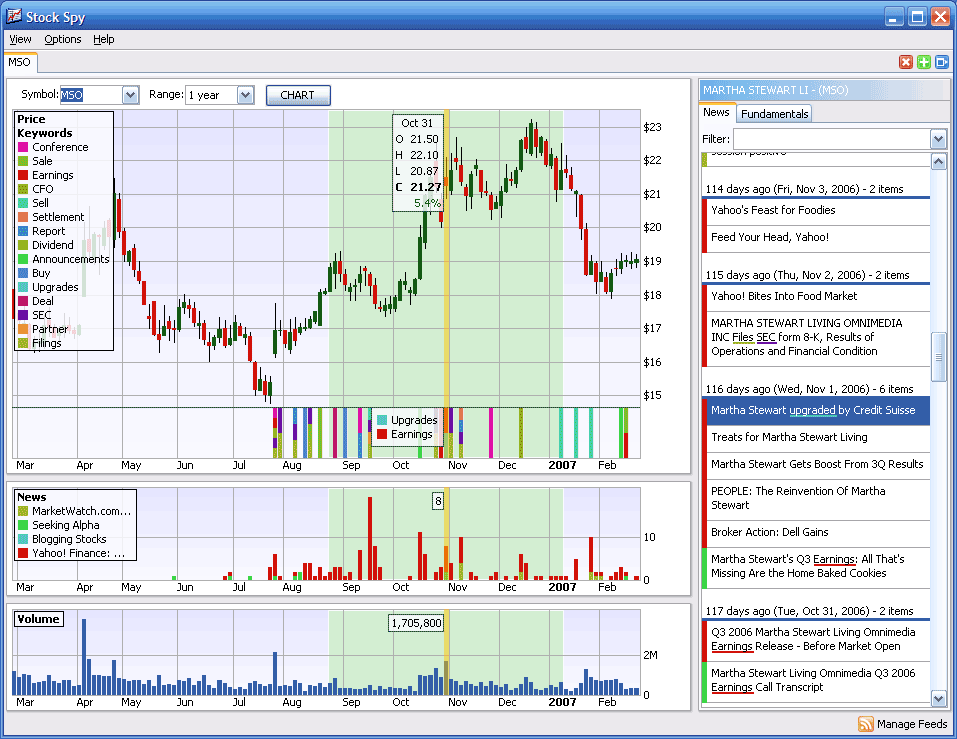
(Click to Enlarge)
Have you ever seen a stock chart and wondered what made the stock shoot up like a rocket or drop like a rock? Stock Spy is unlike any other stock chart because it helps explain what you're seeing. It clearly displays the news and company events which cause the price movements - directly on the chart. Stock Spy shows you relationship the between stock news and stock price. Stock Spy's unique NewsChart system simplifies stock research. NewsVolume charts allow important company events to literally, "pop up". You see at a glance how news buzz of a stock has changed over time. You can select a time range with your mouse directly on the chart and narrow your focus to the selected news. Stock news headlines are automatically displayed for your selection and the full story is always one click away. Stock Spy includes smart: filtering, highlighting and categorization of news. Stock Spy's FinanceTerms system works with NewsCharts to highlight import types of stock news events. FinanceTerms analyse the stock news for key terms (For example: "Upgrade", "Analyst", "SEC Filings" etc.). FinanceTerms let you mark each occurrence of these categorized news items directly on the chart so you can pinpoint when certain types of events happened and what impact they made on the stock. Stock Spy keeps you updated with the latest news related to your stocks with Stock Spy NewsAlerts on your desktop. You are notified about important news which can make you quick profits or save you from devastating losses.
Specifications:
Version: 1.37 |
Download
|

Similar Products:
MODULUSFE MODULUS STOCKCHARTX 5.8
Development :: Basic, VB, VB DotNet
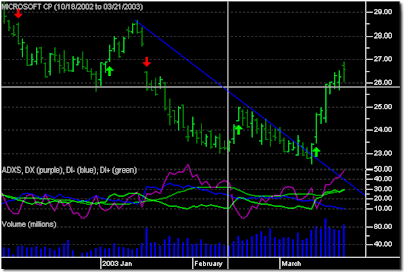 For .NET, VB6, C++ and other languages: StockChartX is a component that can import raw stock data, display it graphically, embed chart objects, and save/load in XML file format. Includes OHLC, Candlesticks, Renko, Kagi, Three Line Break, Point & Figure, Candlevolume, Equivolume, Shaded Equivolume, Darvas Boxes, plus over 150 technical analisys indicators, and line studies including Speed Lines, Gan Fans, Fibonacci and so much more!
Windows MAC Linux | Commercial
Read More
Development :: Basic, VB, VB DotNet
For .NET, VB6, C++ and other languages: StockChartX is a component that can import raw stock data, display it graphically, embed chart objects, and save/load in XML file format. Includes OHLC, Candlesticks, Renko, Kagi, Three Line Break, Point & Figure, Candlevolume, Equivolume, Shaded Equivolume, Darvas Boxes, plus over 150 technical analisys indicators, and line studies including Speed Lines, Gan Fans, Fibonacci and so much more!
Windows MAC Linux | Commercial
Read More
Business :: Accounting & Finance
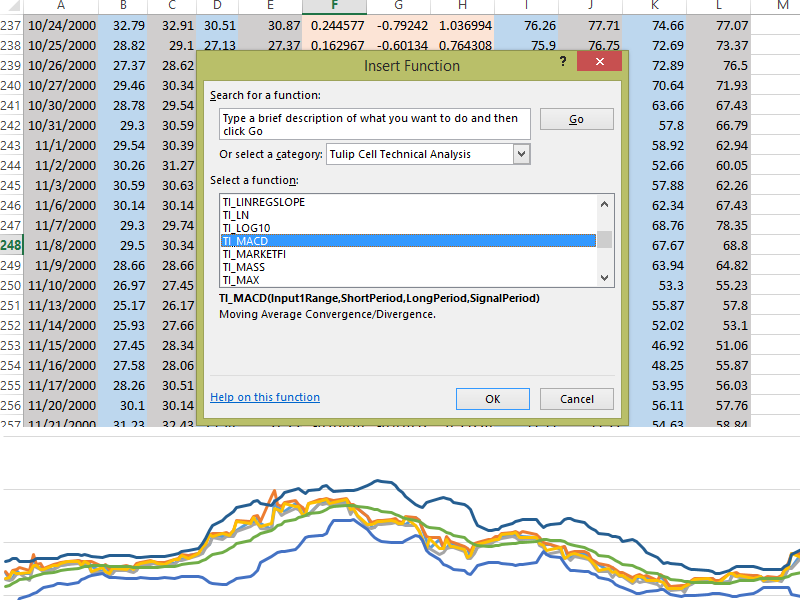 Tulip Cell is a Microsoft Excel add-in that provides over 100 technical analysis overlays and indicators. It provides indicators like moving average, MACD, Bollinger Bands, Stochastic, RSI, Parabolic SAR, and many more. Whether you're doing stock market, Forex, commodity market, or futures analysis, Tulip Cell is the best way to do technical analysis in Excel for free. Tulip Cell is completely free. The automated installer makes setup easy.
Windows | Freeware
Read More