


N5 Net Software Repository
Your one-stop for all your software needs.
Search N5 Net Software Repository:
Search Files
Sponsor:
Browse:
- Audio & Multimedia (1582)
- Business (1741)
- Communications (469)
- Desktop (134)
- Development (571)
- Education (165)
- Games & Entertainment (709)
- Graphic Apps (683)
- Home & Hobby (106)
- Network & Internet (544)
- Security & Privacy (505)
- Servers (67)
- System Utilities (9267)
- Web Development (284)
Areas Of Interest
Authors Area
Are you a software author? Take a look at our Author Resource Center where you will find marketing tools, software specifically created for promoting your software and a ton of other helpful resources.
GrafEq 2.13

(Click to Enlarge)
GrafEq (pronounced 'graphic') is an intuitive, flexible, precise and robust program for producing graphs of implicit relations. GrafEq is designed to foster a strong visual understanding of mathematics by providing a reliable graphing engine that encourages exploration.
Specifications:
Version: 2.13 |
Download
|

Similar Products:
BATCH FILE ENCRYPT FREE 5.0.135
Security & Privacy :: Encryption Tools
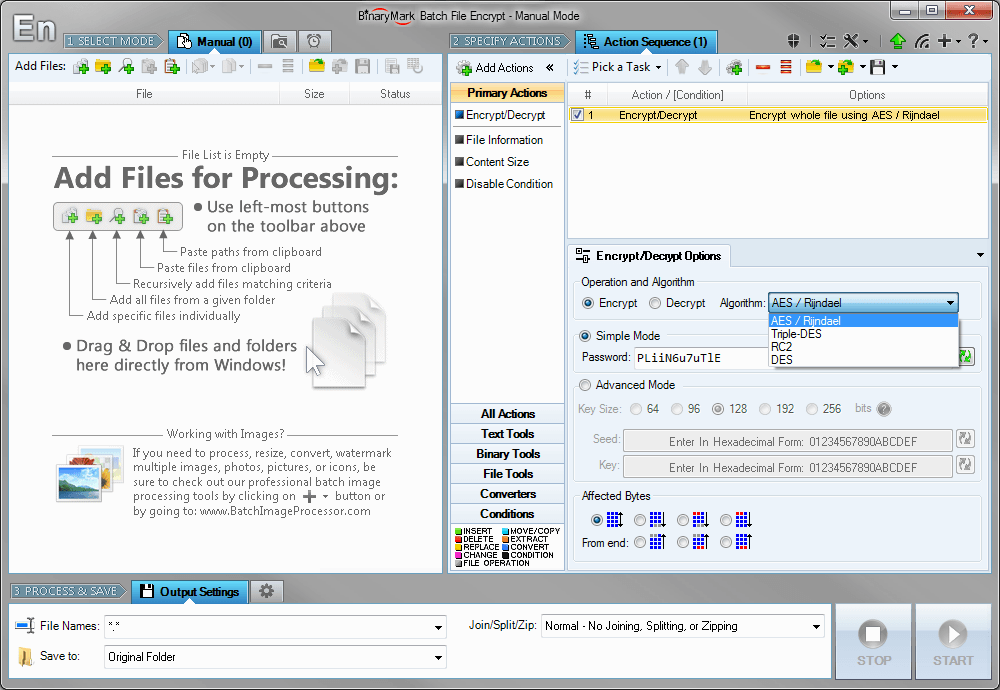 Encrypt and decrypt whole files or their parts using AES, Triple-DES (3DES), RC2, and DES symmetric algorithms. You can encrypt files with a single password or specify cryptographic keys (vectors) instead. You can change key bit length for better protection. You can select specifically which bytes in a file should be encrypted/decrypted, though by default the whole file is processed.
Windows | Shareware
Read More
AMC PRESENTATION WIZARD 17.0A.1
Audio & Multimedia :: Presentation Tools
![]() AMC Presentation Wizard builds self-displaying, interactive slide shows, photo albums, brochures, clickable advertisements, distributable portfolios and other multimedia applications that display on Windows systems without additional software. Use your choice of pictures, sounds, animations, graphic elements and clickable web page links. Download an evaluation copy and try it out. Transform your ideas into professional presentations.
AMC Presentation Wizard builds self-displaying, interactive slide shows, photo albums, brochures, clickable advertisements, distributable portfolios and other multimedia applications that display on Windows systems without additional software. Use your choice of pictures, sounds, animations, graphic elements and clickable web page links. Download an evaluation copy and try it out. Transform your ideas into professional presentations.
Windows | Shareware
Read More
AMC PNG-MNG CONSTRUCTION SET 17.0A.3
Graphic Apps :: Animation Tools
![]() AMC PNG-MNG Construction Set represents the state-of-the-art in animation software. Assemble your original animations effortlessly through its Animation Wizard, squeeze them down with its Supercompressor; create eye-catching banners and animated transitions; add transparency to PNG graphics and lots more. Animated PNG and WebP transcend the color and structural limitations of GIF files. Get up to speed quickly with its extensive documentation.
AMC PNG-MNG Construction Set represents the state-of-the-art in animation software. Assemble your original animations effortlessly through its Animation Wizard, squeeze them down with its Supercompressor; create eye-catching banners and animated transitions; add transparency to PNG graphics and lots more. Animated PNG and WebP transcend the color and structural limitations of GIF files. Get up to speed quickly with its extensive documentation.
Windows | Shareware
Read More
Graphic Apps :: Viewers
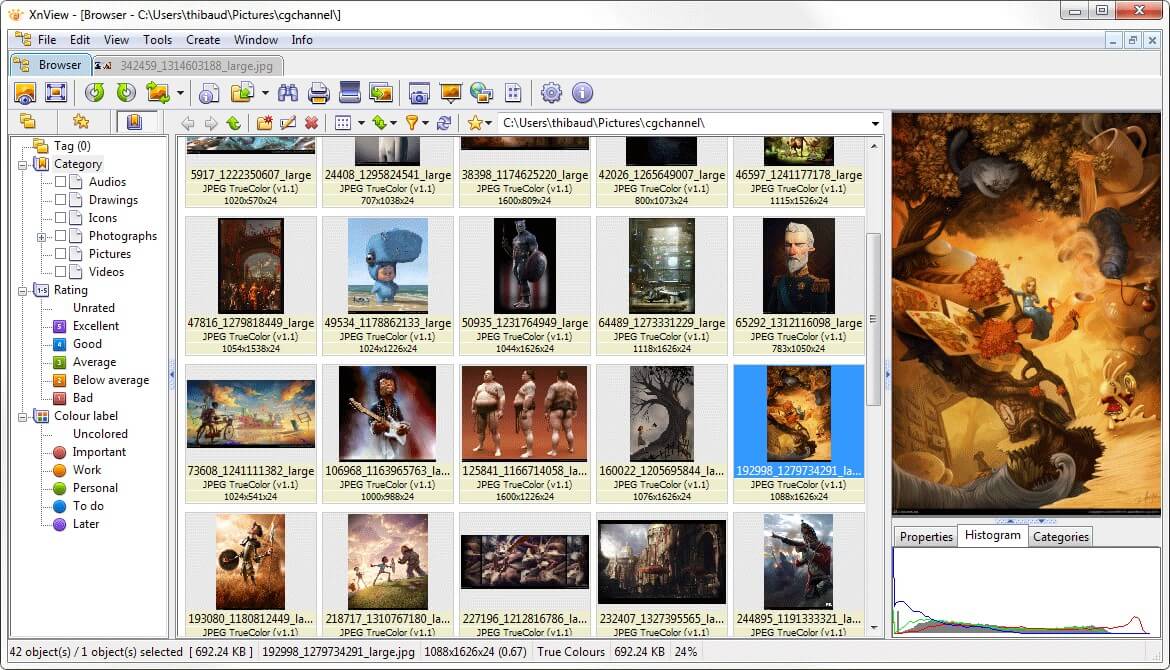 XnView is a fast multi-format graphics browser, viewer, and converter. It reads more than 400 file formats, e.g. gif, bmp, jpg, png, tiff, mpeg, avi, and many more. XnView has an Explorer-like viewer that allows quick browsing of directory contents in both thumbnail and preview views. Its features include contact sheets, twain support (scanner & digital cameras), batch conversion, image processing with many filters and effects, and slide sho
Windows | Freeware
Read More