


N5 Net Software Repository
Your one-stop for all your software needs.
Search N5 Net Software Repository:
Search Files
Sponsor:
Browse:
- Audio & Multimedia (1582)
- Business (1733)
- Communications (469)
- Desktop (135)
- Development (557)
- Education (165)
- Games & Entertainment (706)
- Graphic Apps (681)
- Home & Hobby (105)
- Network & Internet (538)
- Security & Privacy (504)
- Servers (67)
- System Utilities (9263)
- Web Development (281)
Areas Of Interest
Authors Area
Are you a software author? Take a look at our Author Resource Center where you will find marketing tools, software specifically created for promoting your software and a ton of other helpful resources.
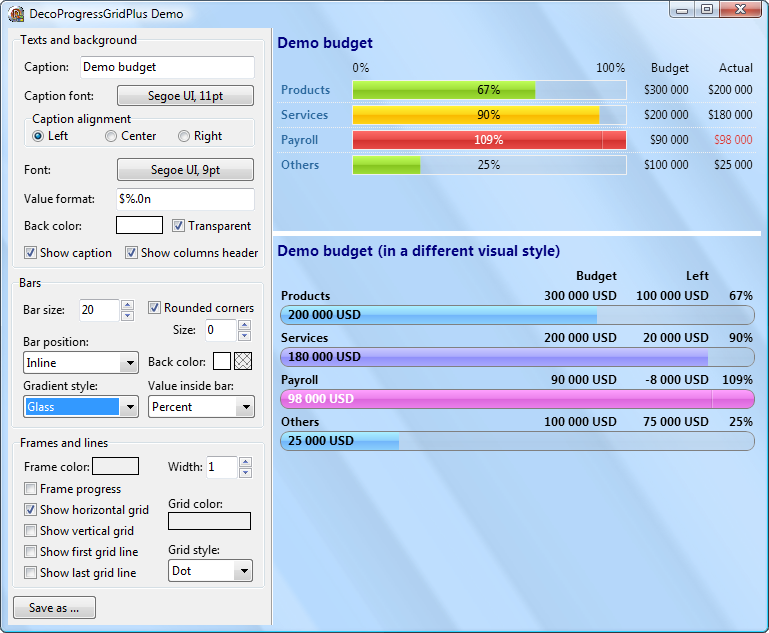
DecoCharts for VCL 1.3
Development :: Components & Libraries
(Click to Enlarge)
A set of interactive charting components for Embarcadero Delphi, that can extended your applications with decomposition bar charts, budget status indicators, KPI status tables, comparison tables and similar presentations. Components are designed as a lightweight alternative to universal grids and charting components. Every component from the DecoCharts package can be used separately for its concrete purposes, without some resource-heavy universal component class in the background. DecoCharts components are designed for all Delphi versions. What's included? * TDecoBar: An interactive decomposition chart, that allows you to present a different types of financial, statistical or general numeric data in a clear form of expandable bars. * TDecoProgressGrid A specialized grid of progress bars and their additional (supporting) data. Such a grid is a perfect for presenting a various kinds of budgets, KPI values and other data that need to be displayed in a percentage form. * TDecoCompareGrid Implements an easy to use comparison table that is based on the list of criterias, the list of alternatives and criteria values for each alternative. * TDecoRatingStars It is a simple interactive rating component. You can use it to display, or to get the user rating feedback. * TDecoProgressBar Standalone progress bar component, that mimics the visual style of progress bars used in other complex DecoCharts controls. * TDecoBarPlus, TDecoProgressGridPlus and other components with "Plus" suffix Descendants of the standard DecoCharts components (mentioned above), that use the GDI+ library for antialiased and composited drawing. This enhances the look and the feel of resulting charts/grids. DecoChartsPlus components supports also the Aero-Glass effect, so they can be used in conjunction with GlassFrame and ParentBackground options of your forms (for Delphi 2007 and above).
Specifications:
Version: 1.3 |
Download
|

Similar Products:
Graphic Apps :: Other
 A tool for creating flowcharts and similar diagrams. It allows you to work with a single object or a group of objects, drawing boxes or symbols of many shapes and connecting them with lines of various types. Extensive features such as full zoom, OLE connectivity for inserting charts in other documents, poster printing, graphics import and export, automatic routing, curves, flow symbols, and much more.
Windows | Shareware
Read More
Graphic Apps :: Other
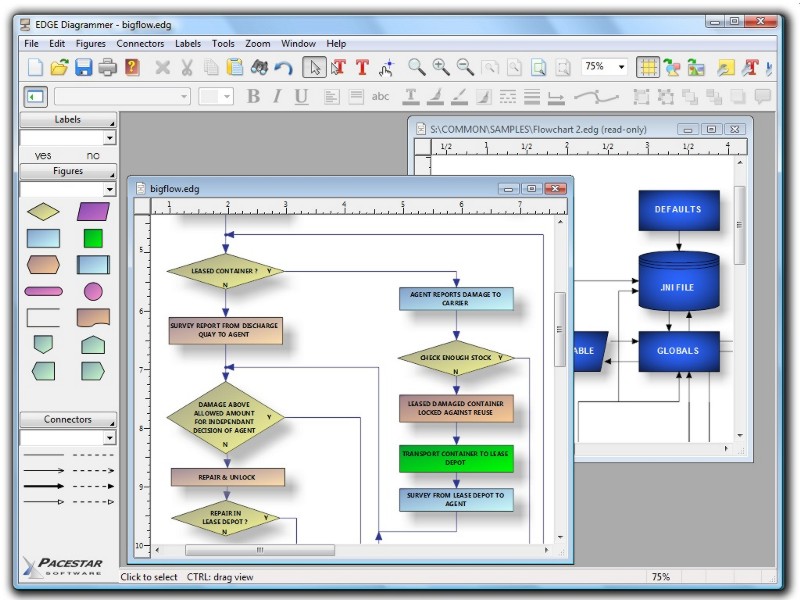 Professional diagramming and flowcharting tool that focuses on ease of learning and use. Create any type of block diagrams with shapes connected by arrows. Built in shapes and arrow heads, plus create your own. Contains many features only found in very expensive packages such as full zoom, OLE connectivity, poster printing, graphics import and export.
Windows | Shareware
Read More
Audio & Multimedia :: Presentation Tools
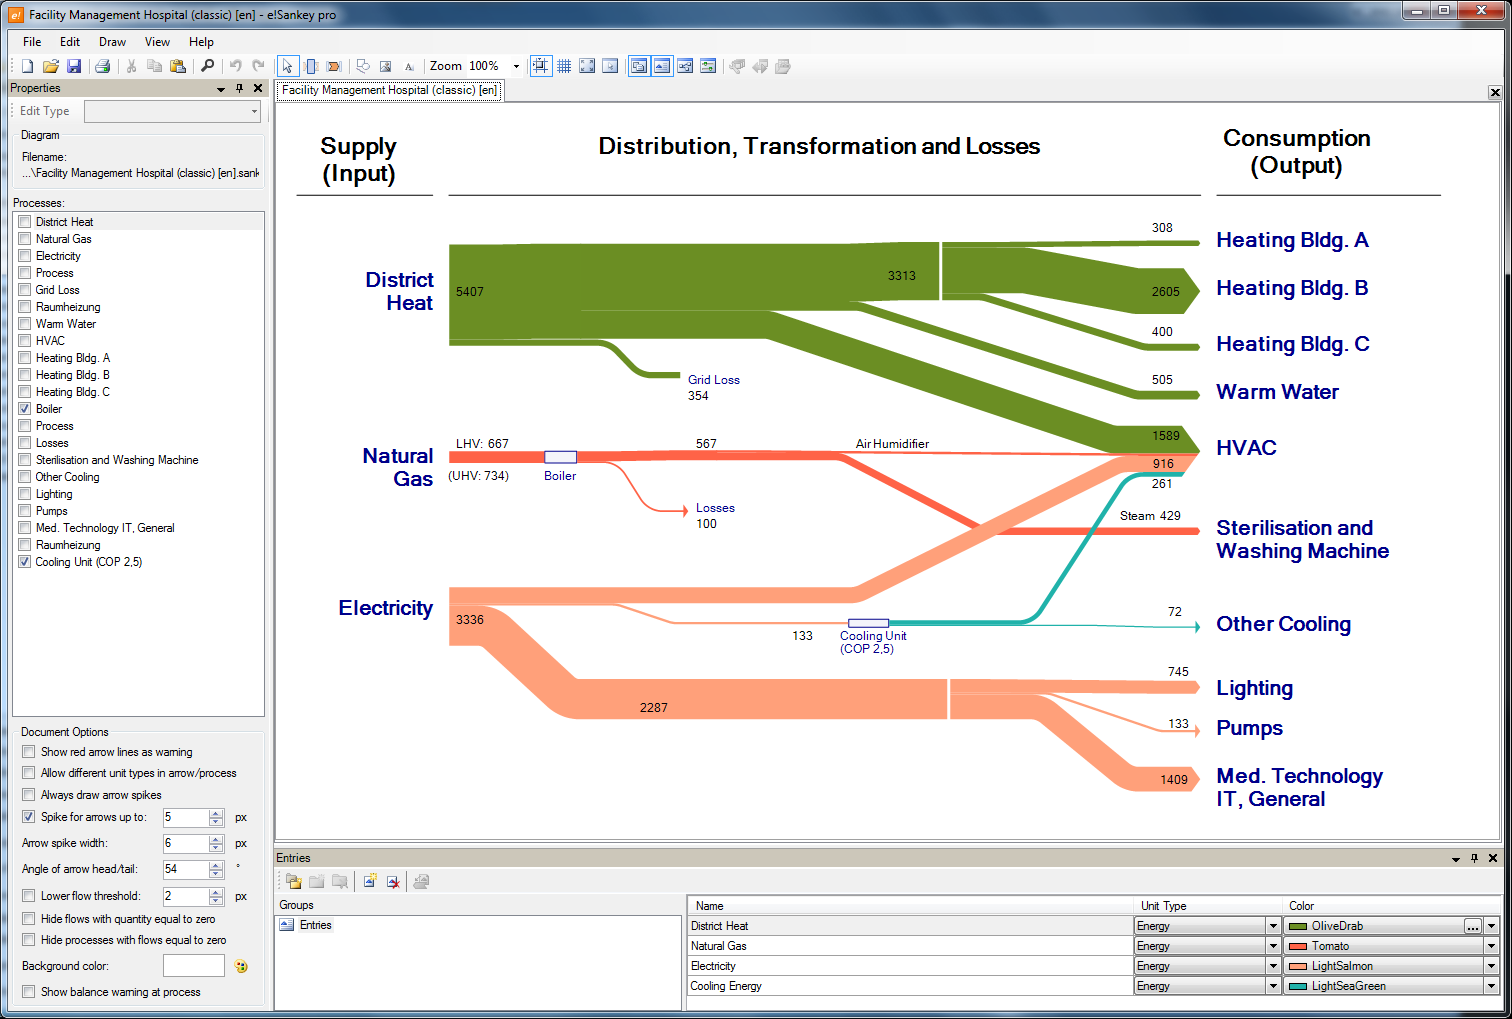 A software to easily create Sankey diagrams. A Sankey diagram is a directional flow chart where the width of the arrows is proportional to the flow quantity. Sankey diagrams are a useful way of visualizing material flows, energy or costs. If you are a chemical, environmental or process engineer, a professional in quality management, logistics or finance, you can use e!Sankey diagrams to display flow quantities in production systems. Excel import.
Windows | Shareware
Read More
Audio & Multimedia :: Presentation Tools
A software to easily create Sankey diagrams. A Sankey diagram is a directional flow chart where the width of the arrows is proportional to the flow quantity. Sankey diagrams are a useful way of visualizing material flows, energy or costs. If you are a chemical, environmental or process engineer, a professional in quality management, logistics or finance, you can use e!Sankey diagrams to display flow quantities in production systems.
Windows | Shareware
Read More