


N5 Net Software Repository
Your one-stop for all your software needs.
Search N5 Net Software Repository:
Search Files
Sponsor:
Browse:
- Audio & Multimedia (1596)
- Business (4238)
- Communications (1257)
- Desktop (183)
- Development (602)
- Education (171)
- Games & Entertainment (702)
- Graphic Apps (686)
- Home & Hobby (107)
- Network & Internet (571)
- Security & Privacy (532)
- Servers (65)
- System Utilities (11196)
- Web Development (284)
Areas Of Interest
Authors Area
Are you a software author? Take a look at our Author Resource Center where you will find marketing tools, software specifically created for promoting your software and a ton of other helpful resources.
Search: technical analysis
Business :: Investment Tools
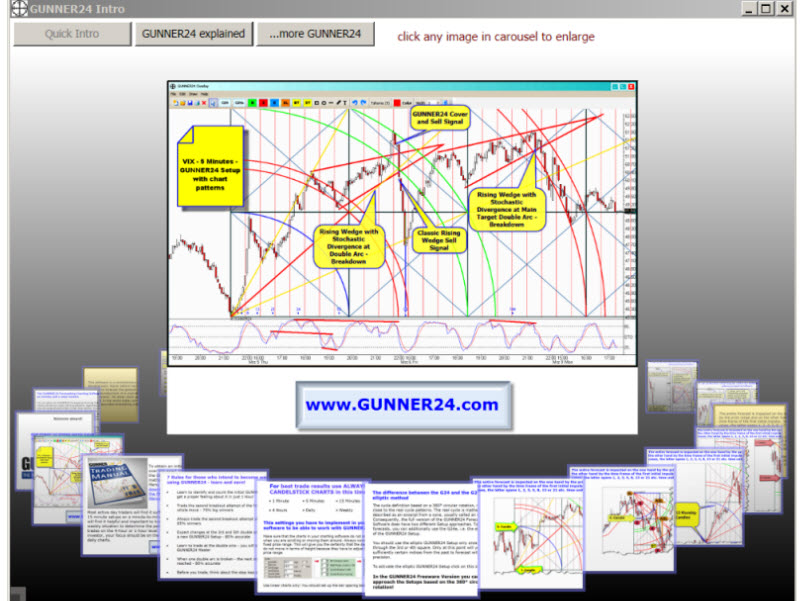 Seize the opportunity to get to know the GUNNER24 Forecasting Method fundamentals. The GUNNER24 Charting Software will allow you to familiarize yourself with the functions of the GUNNER24 Concept and to post trade in accordance with the GUNNER24 Trading System. You will be able to create the GUNNER24 Forecasting Setups using any chart generated with your own charting software, or any chart obtained from the Internet or any other application.
Windows | Freeware
Read More | Download Now
MODULUSFE MODULUS STOCKCHARTX 5.8
Development :: Basic, VB, VB DotNet
 For .NET, VB6, C++ and other languages: StockChartX is a component that can import raw stock data, display it graphically, embed chart objects, and save/load in XML file format. Includes OHLC, Candlesticks, Renko, Kagi, Three Line Break, Point & Figure, Candlevolume, Equivolume, Shaded Equivolume, Darvas Boxes, plus over 150 technical analisys indicators, and line studies including Speed Lines, Gan Fans, Fibonacci and so much more!
Windows MAC Linux | Commercial
Read More | Download Now
Business :: Accounting & Finance
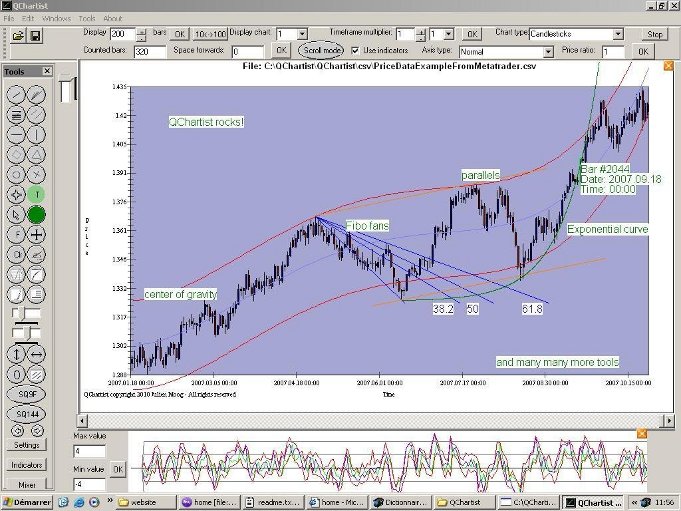 QChartist is a free charting software to do technical analysis on any data like Forex, Stocks. It helps to make market forecasts with the help of technical objects and indicators. You can draw geometrical shapes on your charts or plot programmable indicators from your data. It is also possible to filter or merge data. It has built-in astro indicators and realtime quotes.
Windows | Freeware
Read More | Download Now
Development :: Basic, VB, VB DotNet
For .NET, VB6, C++ and other languages: StockChartX is a component that can import raw stock data, display it graphically, embed chart objects, and save/load in XML file format. Includes OHLC, Candlesticks, Renko, Kagi, Three Line Break, Point & Figure, Candlevolume, Equivolume, Shaded Equivolume, Darvas Boxes, plus over 150 technical analisys indicators, and line studies including Speed Lines, Gan Fans, Fibonacci and so much more!
Windows MAC Linux | Commercial
Read More | Download Now
Business :: Investment Tools
 All-in-one investment solution for Microsoft Excel: 165 technical analysis functions, historical data downloads, real-time quotes, strategy backtesting, portfolio, neural network-based prediction and clustering. You can automatically build charts, create macros, download free historical end-of-day, delayed and real-time data for stocks, options, indexes, mutual funds, futures and other securities for more than 50 markets worldwide.
Windows | Shareware
Read More | Download Now
Business :: Accounting & Finance
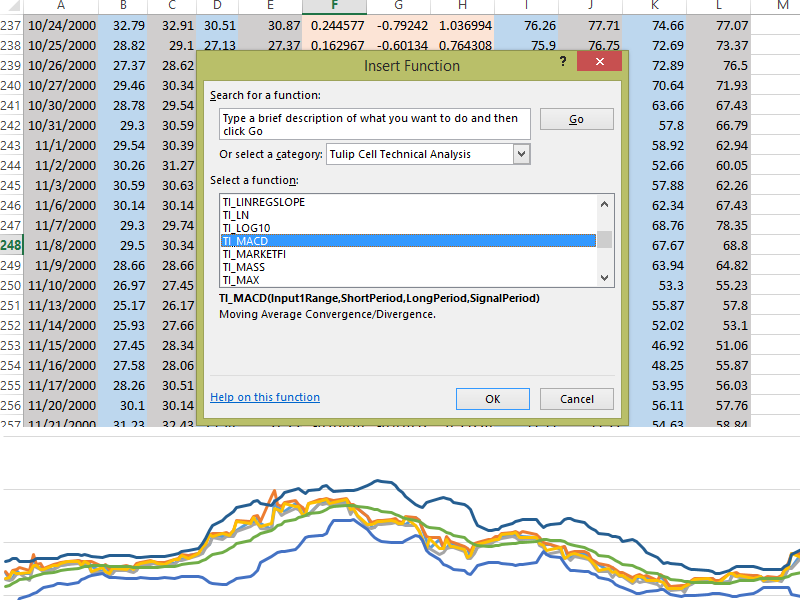 Tulip Cell is a Microsoft Excel add-in that provides over 100 technical analysis overlays and indicators. It provides indicators like moving average, MACD, Bollinger Bands, Stochastic, RSI, Parabolic SAR, and many more. Whether you're doing stock market, Forex, commodity market, or futures analysis, Tulip Cell is the best way to do technical analysis in Excel for free. Tulip Cell is completely free. The automated installer makes setup easy.
Windows | Freeware
Read More | Download Now