Search N5 Net Software Repository:
Search Files
Sponsor:
Browse:
- Audio & Multimedia (1596)
- Business (4238)
- Communications (1257)
- Desktop (183)
- Development (602)
- Education (171)
- Games & Entertainment (702)
- Graphic Apps (686)
- Home & Hobby (107)
- Network & Internet (571)
- Security & Privacy (532)
- Servers (65)
- System Utilities (11196)
- Web Development (284)
Areas Of Interest
Authors Area
Are you a software author? Take a look at our Author Resource Center where you will find marketing tools, software specifically created for promoting your software and a ton of other helpful resources.
Search: stock chart
Business :: Accounting & Finance
 Ashkon Stock Watch is an advanced charting software for stock market traders. Unlike a conventional financial website it allows to display several technical indicators for a single market security on the same chart, open multiple chart documents, maintain predefined lists of securities and test your own investment strategies by placing virtual Buys and Sells on a chart. Charting stocks listed at international stock exchanges is supported.
Windows | Shareware
Read More | Download Now
Home & Hobby :: Personal Finance
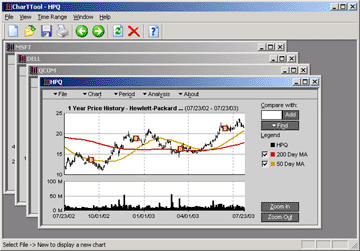
 CharTTool is stock charting software. In addition to charting US and international stocks you may chart historical currency exchange rates, mutual funds and market indices. Intraday and end-of-day stock charting is supported. The list of technical indicators includes Bollinger bands, price channels, moving averages, fast and slow stochastic oscillators, RSI, MACD, trading volume and others. International stock exchanges are supported.
Windows | Shareware
Read More | Download Now
MODULUSFE MODULUS STOCKCHARTX 5.8
Development :: Basic, VB, VB DotNet
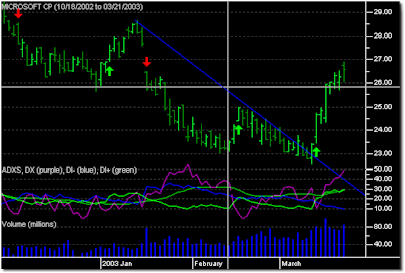
 For .NET, VB6, C++ and other languages: StockChartX is a component that can import raw stock data, display it graphically, embed chart objects, and save/load in XML file format. Includes OHLC, Candlesticks, Renko, Kagi, Three Line Break, Point & Figure, Candlevolume, Equivolume, Shaded Equivolume, Darvas Boxes, plus over 150 technical analisys indicators, and line studies including Speed Lines, Gan Fans, Fibonacci and so much more!
Windows MAC Linux | Commercial
Read More | Download Now
STOCK SPY - RSS STOCK NEWS CHARTS 1.37
Business :: Investment Tools
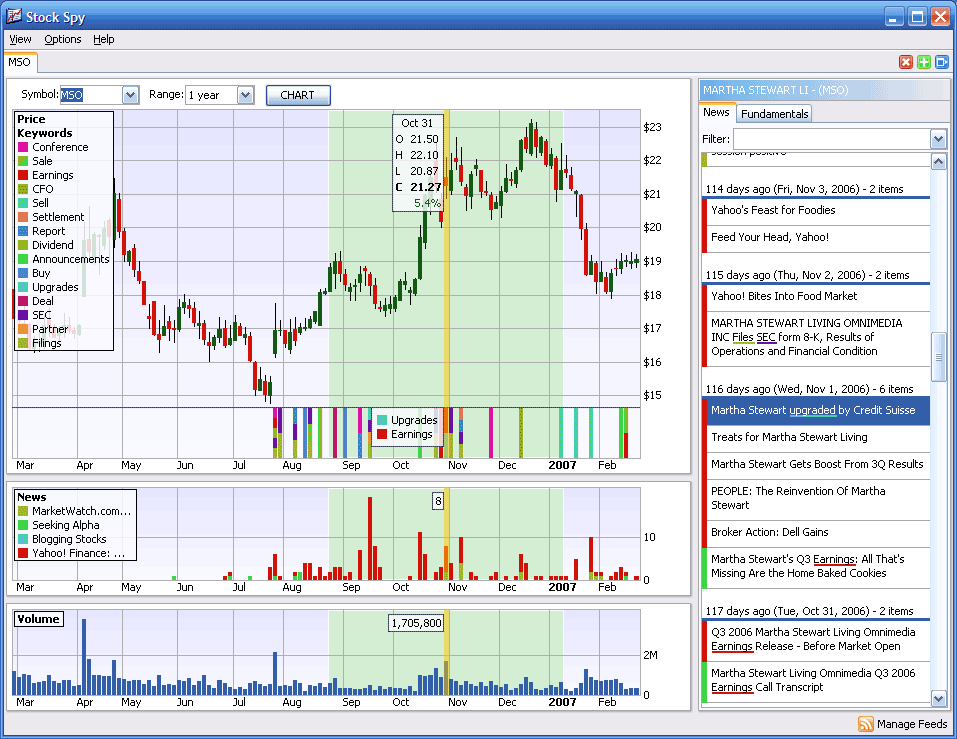
 Stock Spy is unlike any other stock chart because it helps explain what you're seeing. It clearly displays the news and company events which cause the price movements - directly on the chart. Stock Spy shows you relationship between the stock news and the stock price.
Windows | Demo
Read More | Download Now
Development :: Basic, VB, VB DotNet
 For .NET, VB6, C++ and other languages: StockChartX is a component that can import raw stock data, display it graphically, embed chart objects, and save/load in XML file format. Includes OHLC, Candlesticks, Renko, Kagi, Three Line Break, Point & Figure, Candlevolume, Equivolume, Shaded Equivolume, Darvas Boxes, plus over 150 technical analisys indicators, and line studies including Speed Lines, Gan Fans, Fibonacci and so much more!
Windows MAC Linux | Commercial
Read More | Download Now
Business :: Investment Tools
 All-in-one investment solution for Microsoft Excel: 165 technical analysis functions, historical data downloads, real-time quotes, strategy backtesting, portfolio, neural network-based prediction and clustering. You can automatically build charts, create macros, download free historical end-of-day, delayed and real-time data for stocks, options, indexes, mutual funds, futures and other securities for more than 50 markets worldwide.
Windows | Shareware
Read More | Download Now
Business :: Accounting & Finance
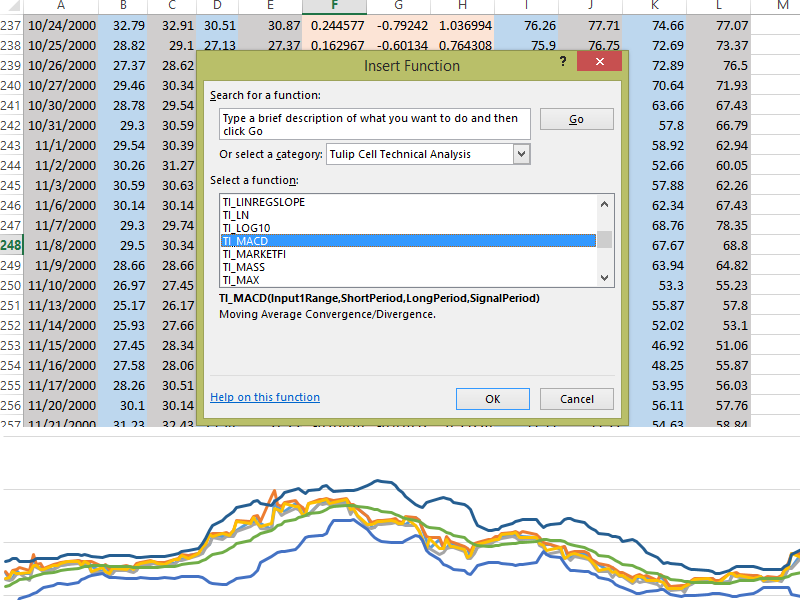
 Tulip Cell is a Microsoft Excel add-in that provides over 100 technical analysis overlays and indicators. It provides indicators like moving average, MACD, Bollinger Bands, Stochastic, RSI, Parabolic SAR, and many more. Whether you're doing stock market, Forex, commodity market, or futures analysis, Tulip Cell is the best way to do technical analysis in Excel for free. Tulip Cell is completely free. The automated installer makes setup easy.
Windows | Freeware
Read More | Download Now
[1]


