


N5 Net Software Repository
Your one-stop for all your software needs.
Search N5 Net Software Repository:
Search Files
Sponsor:
Browse:
- Audio & Multimedia (1582)
- Business (1741)
- Communications (469)
- Desktop (134)
- Development (571)
- Education (165)
- Games & Entertainment (709)
- Graphic Apps (683)
- Home & Hobby (106)
- Network & Internet (544)
- Security & Privacy (505)
- Servers (67)
- System Utilities (9267)
- Web Development (284)
Areas Of Interest
Authors Area
Are you a software author? Take a look at our Author Resource Center where you will find marketing tools, software specifically created for promoting your software and a ton of other helpful resources.
Search: chart
SMSCHEMA SUITE FOR DELPHI/CBUILDER 1.20
Development :: Delphi
 SMSchema suite is the components for data modeling, flowchart and block/scheme engineering:
- TSchemaDesignArea: visual design pane to draw the model
- TSQLBuilderDialog: Visual Query Builder to construct the SQL-statement
Custom engines for databases allow to use any data source (BDE, ADO, dbExpress, memory etc)
SMSchema is a native VCL engine with multilanguage support.
SMSchema suite is the components for data modeling, flowchart and block/scheme engineering:
- TSchemaDesignArea: visual design pane to draw the model
- TSQLBuilderDialog: Visual Query Builder to construct the SQL-statement
Custom engines for databases allow to use any data source (BDE, ADO, dbExpress, memory etc)
SMSchema is a native VCL engine with multilanguage support.
Windows | Shareware
Read More | Download Now
STOCK SPY - RSS STOCK NEWS CHARTS 1.37
Business :: Investment Tools
 Stock Spy is unlike any other stock chart because it helps explain what you're seeing. It clearly displays the news and company events which cause the price movements - directly on the chart. Stock Spy shows you relationship between the stock news and the stock price.
Windows | Demo
Read More | Download Now
Development :: Basic, VB, VB DotNet
 For .NET, VB6, C++ and other languages: StockChartX is a component that can import raw stock data, display it graphically, embed chart objects, and save/load in XML file format. Includes OHLC, Candlesticks, Renko, Kagi, Three Line Break, Point & Figure, Candlevolume, Equivolume, Shaded Equivolume, Darvas Boxes, plus over 150 technical analisys indicators, and line studies including Speed Lines, Gan Fans, Fibonacci and so much more!
Windows MAC Linux | Commercial
Read More | Download Now
Business :: Investment Tools
 All-in-one investment solution for Microsoft Excel: 165 technical analysis functions, historical data downloads, real-time quotes, strategy backtesting, portfolio, neural network-based prediction and clustering. You can automatically build charts, create macros, download free historical end-of-day, delayed and real-time data for stocks, options, indexes, mutual funds, futures and other securities for more than 50 markets worldwide.
Windows | Shareware
Read More | Download Now
Business :: Accounting & Finance
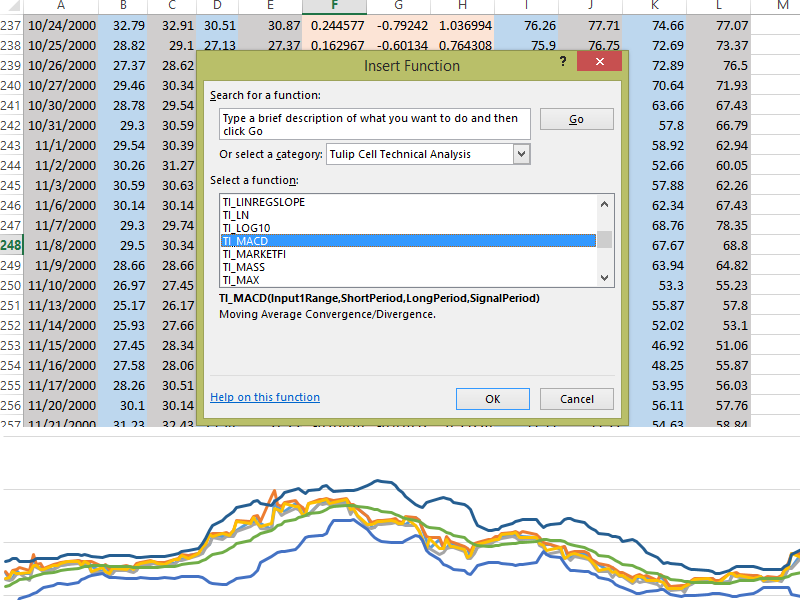 Tulip Cell is a Microsoft Excel add-in that provides over 100 technical analysis overlays and indicators. It provides indicators like moving average, MACD, Bollinger Bands, Stochastic, RSI, Parabolic SAR, and many more. Whether you're doing stock market, Forex, commodity market, or futures analysis, Tulip Cell is the best way to do technical analysis in Excel for free. Tulip Cell is completely free. The automated installer makes setup easy.
Windows | Freeware
Read More | Download Now
Development :: Other
 The Rustemsoft UIChart control enables to create iOS apps with simple, intuitive, and visually compelling chart for complex statistical or financial analysis in different graph types that include Pie, Bar, Line, Cylinder, Area, and other chart types. You can use the UIChart control to show graphs of a small amount of data, or you can scale it to show charts of very large sets of data.
Windows | Shareware
Read More | Download Now
VERYUTILS DIAGRAM EDITOR SOFTWARE 2.7
Business :: Office Suites & Tools
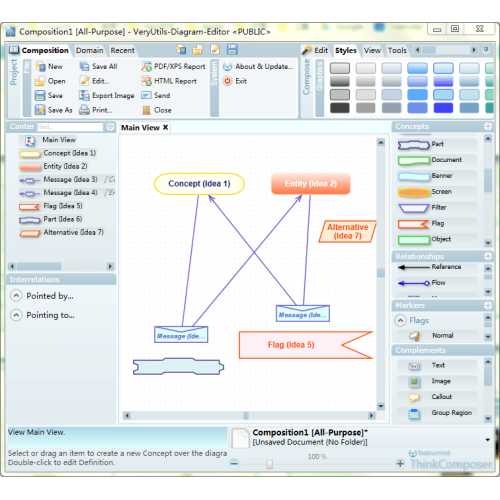 VeryUtils Diagram Editor is an extremely powerful all-in-one diagramming tool that can serve all of your purposes. Whether you need to draw flowcharts, fishbone diagrams, UML diagrams or design floor plans, office layouts, you can find what you want in Diagram Editor software. Importantly, it is quite affordable. With VeryUtils Diagram Editor software, you can apply the power of comprehensive visual documents to get the job done and work better.
Windows | Shareware
Read More | Download Now
Development :: Other
 Visualize your source code with flow charts and UML Activity Diagrams. Visustin reverse engineers code to flow charts automatically. Use flow charts in code review and software maintenance. Visualize complex functions. Understand existing code. Review and debug algorithms. Verify program logic. View, save and print flow charts. Export flow charts to Visio. Visustin supports 49 popular programming languages.
Windows | Shareware
Read More | Download Now
Graphic Apps :: Other
 A tool for creating flowcharts and similar diagrams. It allows you to work with a single object or a group of objects, drawing boxes or symbols of many shapes and connecting them with lines of various types. Extensive features such as full zoom, OLE connectivity for inserting charts in other documents, poster printing, graphics import and export, automatic routing, curves, flow symbols, and much more.
Windows | Shareware
Read More | Download Now
YAPP THE PROJECT CALCULATOR 2.0
::
 Yapp the project calculator, Keep track of what to do and who's doing it. Rule based planning allows you to get some real help not only a controlled drawing environment. This project planning tool gives you up to date warnings on common rule violations like resource overuse, deadline breach, and dependency violations, information that is crucial to you in order to build a realistic and working project plan. Export and import to Excel
Windows | Shareware
Read More | Download Now