


N5 Net Software Repository
Your one-stop for all your software needs.
Search N5 Net Software Repository:
Search Files
Sponsor:
Browse:
- Audio & Multimedia (3039)
- Business (5565)
- Communications (1642)
- Desktop (531)
- Development (1260)
- Education (505)
- Games & Entertainment (1131)
- Graphic Apps (1290)
- Home & Hobby (269)
- Network & Internet (1005)
- Security & Privacy (1246)
- Servers (129)
- System Utilities (32725)
- Web Development (518)
Areas Of Interest
Authors Area
Are you a software author? Take a look at our Author Resource Center where you will find marketing tools, software specifically created for promoting your software and a ton of other helpful resources.
Newest Releases:
Todays Files:
KILLEXAMS REAL-ESTATE DRE CA-REAL-ESTATE EXAM DUMP 2024

Education :: Teaching & Training Tools
killexams.com exam prep material gives all of you that you have to pass DRE CA-Real-Estate exam. Our Real-Estate DRE CA-Real-Estate dumps think of questions that are precisely same as real exam. High gauge and impetus for the DRE CA-Real-Estate Exam. We at killexams guarantees your accomplishment in DRE CA-Real-Estate exam with our braindumps.
Windows | Freeware
Read More | Download Now
REPLACEMAGIC.ULTIMATE PROFESSIONAL 2024.2

Business :: Office Suites & Tools
Have you ever been in situation that you move documents to new location and links were broken? This usually happens during Sharepoint migration or network storage changes or maybe new folder structure. ReplaceMagic can help you repair broken links... Simply select location(s) where you need to check for broken links, wait a bit and later set what should be replaced. ReplaceMagic will do everything for you... Prices are starting from $119...
Windows | Shareware
Read More | Download Now
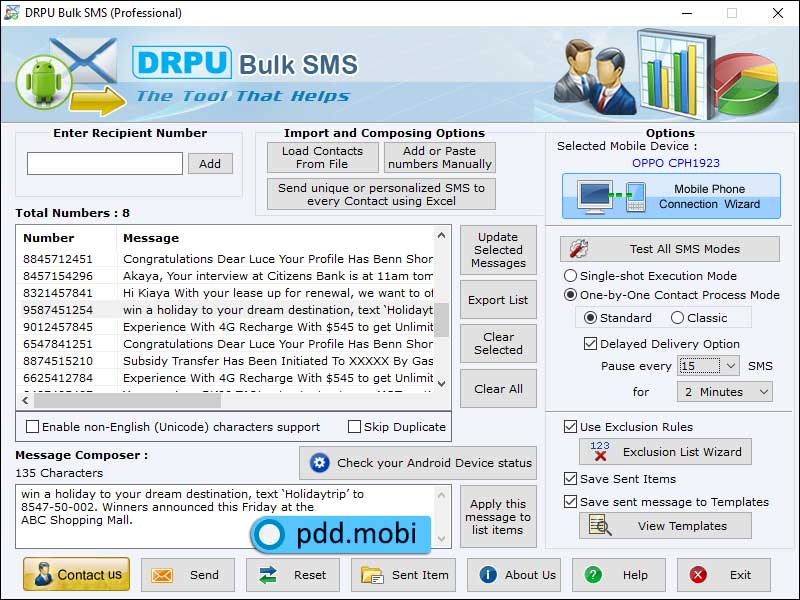
Communications :: Chat & Instant Messaging
PC to mobile SMS broadcasting software provides advanced communication medium to send bulk messages including event notification, greetings, job alerts and other information in a faster and reliable manner from your desktop to GSM mobiles. Mass sms sending tool supports all national, international mobile networks to send sms without any internet connection. Bulk text messaging utility is easy to access and provides best graphical user interface.
Windows | Shareware
Read More | Download Now
WAVEPAD MUSIC AND AUDIO EDITOR FREE 19.15
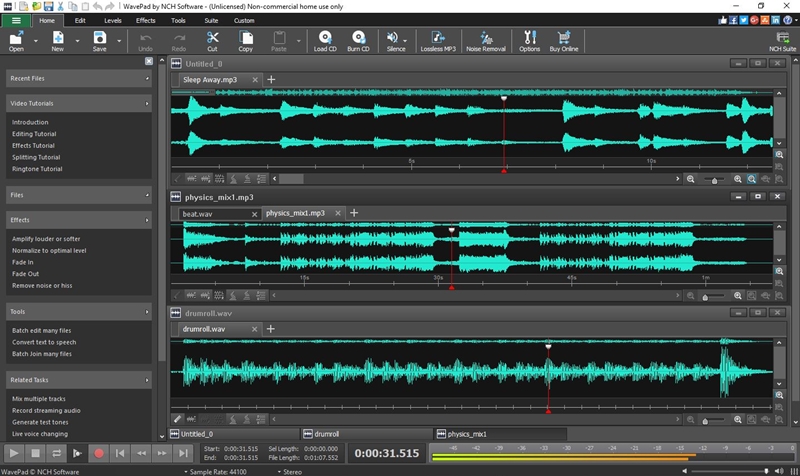
Audio & Multimedia :: Music Composers
Free Music and Audio Editor that is perfect for professional audio editors or for someone just wanting to edit some personal audio files. This free sound editor includes several effects such as amplify, normalize, equalizer, envelope, reverb, and many more. Easily edit audio files with cut, copy, paste, delete, insert and several others. Audio restoration features includes noise reduction and click pop removal.
Windows | Freeware
Read More | Download Now
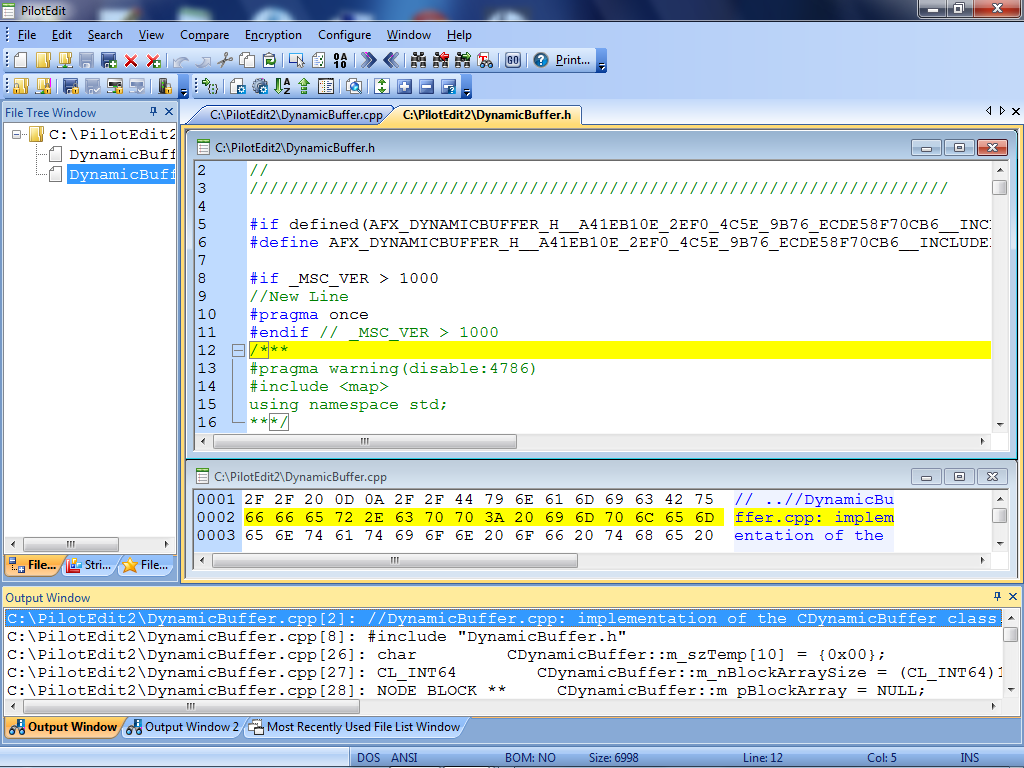
System Utilities :: Text/Document Editors
PilotEdit is a powerful file editor capable of editing huge files larger than 400GB (40 billion lines).
Windows | Shareware
Read More | Download Now
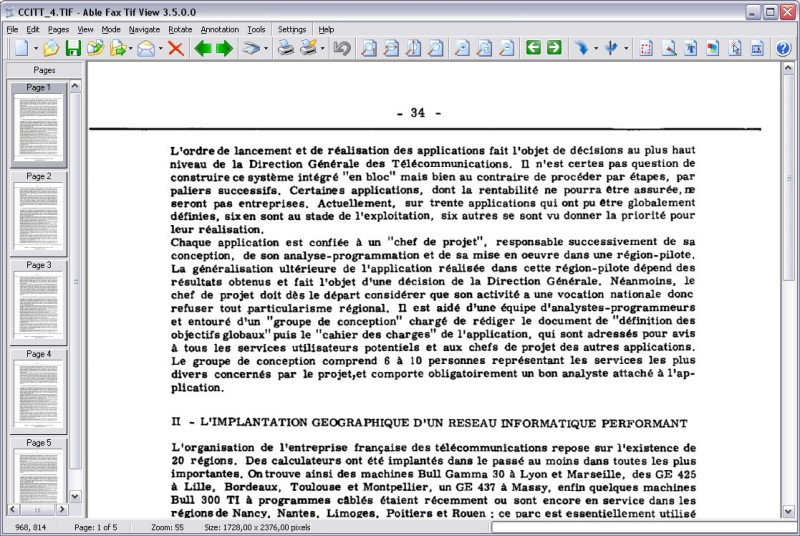
Graphic Apps :: Editors
TIF, PDF, EPS, PS, AI, DCX viewer, editor and converter. Allows to view, edit, print, save, convert your files. Able Fax Tif View can convert one- and multipage files to standard TIFF/FAX format, jpeg, png, bmp, pcx, gif, dib, rle, tga, pdf, ps, eps and more. Able Fax Tif View can edit loaded images - extract, move, insert, delete, rotate, flip, invert pages, remove noise, deskewing image, color adjust, add margins.
Windows | Shareware
Read More | Download Now

Games & Entertainment :: Action
Shipwrecked protagonist washes on an island full of hungry zombies. Now he really must fight to survive. Explore the island in search of weapons and get behind the wheel of the old buggy and run down zombies. How long the hero lives is up to you!
Windows | Freeware
Read More | Download Now
KILLEXAMS CERTIFICATION-BOARD ABPN-VNE EXAM DUMPS 2024

Education :: Teaching & Training Tools
At killexams.com, we give completely tested Certification-Board ABPN-VNE actual Questions and Answers that are recently required for Passing ABPN-VNE test. We truly enable individuals to enhance their knowledge to remember the QA and guarantee. It is a best decision to speed up your position as an expert in the Industry.
Windows | Freeware
Read More | Download Now
KILLEXAMS IAPP IAPP-CIPM EXAM DUMPS 2024 2024

Education :: Teaching & Training Tools
We are specifically conscious that an vital problem within the IT business is that there is unavailability of enormous well worth braindumps. Our exam braindumps offers all of you that you need to take an certification exam. Our IAPP IAPP-CIPM Exam will provide you with exam question with confirmed answers that replicate the real exam. We at killexams.com are made plans to empower you to pass your IAPP-CIPM exam with excessive ratings.
Windows | Freeware
Read More | Download Now
KILLEXAMS MICROSOFT AZ-303 EXAM DUMPS 2024 2024

Education :: Teaching & Training Tools
We are doing great struggle to provide you actual Microsoft Azure Architect Technologies exam questions and answers, alongside explanations. Each question on killexams.com has been confirmed by Microsoft certified specialists. They are exceptionally qualified and confirmed people, who have numerous times of expert experience identified with the Microsoft Azure Architect Technologies exam.
Windows | Freeware
Read More | Download Now
KILLEXAMS ATLASSIAN ACP-100 EXAM DUMPS 2024 2024

Education :: Teaching & Training Tools
killexams.com helps a great many competitors pass the exams and get their confirmations. We have a great many effective audits. Our ACP-100 dumps are solid, reasonable, refreshed and of really best quality to beat the challenges of any IT confirmations. killexams.com exam dumps are latest refreshed in profoundly outflank way on customary premise and material is discharged occasionally. ACP-100 real questions are our quality tested.
Windows | Freeware
Read More | Download Now
KILLEXAMS CISCO 500-701 EXAM DUMPS 2024 2024

Education :: Teaching & Training Tools
killexams.com furnish latest and refreshed Practice Test with Actual test Questions and Answers for new syllabus of Cisco 500-701 Exam. Practice our Real Questions and braindumps to Improve your insight and pass your exam with High Marks. We guarantee your achievement in the Test Center, covering every one of the points of exam and assemble your Knowledge of the 500-701 exam. Pass 4 beyond any doubt with our exact questions.
Windows | Freeware
Read More | Download Now
KILLEXAMS BLOCKCHAIN CBSA EXAM DUMPS 2024 2024

Education :: Teaching & Training Tools
killexams.com BlockChain Certification examine guides are setup by IT specialists. Groups of understudies have been crying that there are an exorbitant number of questions in such a critical number of preparing exams and study help, and they are as of late can not stand to deal with the expense of any more. Seeing killexams.
Windows | Freeware
Read More | Download Now
KILLEXAMS ISA CAP EXAM DUMPS 2024 2024

Education :: Teaching & Training Tools
We are doing fight to giving you actual Certified Authorization Professional exam questions and answers, close by clarifications. Each QA on killexams.com has been affirmed by ISA confirmed authorities. They are extraordinarily qualified and affirmed individuals, who have various occasions of master encounter related to the ISA exams.
Windows | Freeware
Read More | Download Now
CAN I DELETE DUPLICATE MBOX FILES 1.0

System Utilities :: File & Disk Management
Get MBOX Duplicate Remover Tool to implement for how can i delete duplicate MBOX files with all editions of Windows OS such as 11, 10, 8.1, 8, 7, XP, Vista, and so on. The solution also supports to solve how can i delete duplicate MBOX files.
Windows | Shareware
Read More | Download Now
News From Around The Net:
- Software Firm Zuora Explores Options, Including Sale - Yahoo Finance (2024-04-17)
- Zuora (ZUO) Explores Options, Including Sale - Bloomberg (2024-04-17)
- Zuora (ZUO) Explores Options, Including Sale - Bloomberg (2024-04-17)
- Hstoday Open Source Groups Say More Software Projects May Have Been Targeted for Sabotage - HS Today - HSToday (2024-04-17)
- 2024.14 Official Tesla Release Notes - Software Updates - Not a Tesla App (2024-04-17)
- Why Many AI Startups Are Consultancies Posing as Software Businesses - The Information (2024-04-17)
- Logitech announces AI Prompt Builder software with matching mouse - VentureBeat (2024-04-17)
- Labguru joins Titian Software in Battery Ventures Life-Science Platform - Yahoo Finance (2024-04-17)
- OpenAI's GPT-4 can exploit real vulnerabilities by reading security advisories - The Register (2024-04-17)
- 7 Top-Rated Affordable CRM Software - Software Advice (2024-04-17)
- VW Unveils New China EV Software in Bid to Regain Lost Ground - Bloomberg (2024-04-17)
- More open-source project takeover attempts found after XZ Utils attack - CSO Online (2024-04-16)
- Hyundai providing free anti-theft software installion this weekend at Greenspoint Mall - KHOU.com (2024-04-16)