


N5 Net Software Repository
Your one-stop for all your software needs.
Search N5 Net Software Repository:
Search Files
Sponsor:
Browse:
- Audio & Multimedia (1582)
- Business (1733)
- Communications (469)
- Desktop (135)
- Development (557)
- Education (165)
- Games & Entertainment (706)
- Graphic Apps (681)
- Home & Hobby (105)
- Network & Internet (538)
- Security & Privacy (504)
- Servers (67)
- System Utilities (9263)
- Web Development (281)
Areas Of Interest
Authors Area
Are you a software author? Take a look at our Author Resource Center where you will find marketing tools, software specifically created for promoting your software and a ton of other helpful resources.
AnalyzerXL Pro 7.0.3

(Click to Enlarge)
AnalyzerXL Pro is an add-in for Microsoft Excel 2010 and 2013, designed to help you create trade systems and conduct technical analysis calculations directly in your worksheets. Technical Analysis is essentially the methods of predicting the price movement through the use of chart patterns and market indicators. AnalyzerXL Pro Technical Analysis Functions Library allows you to produce your own trading system using all power of Microsoft Excel environment. The Library consists of 81 technical analysis functions, indicators, and alerts which are divided into the following groups: Trend Indicators Volatility Indicators Momentum Indicators Market Strength Indicators Support and Resistance Indicators Additional Functions Alert Functions Key features summary: Intuitive and easy-to-use interface. The comprehensive Technical Analysis Functions Library for MS Excel. Macro creation and management. MS Excel environment provides great possibilities for integration with your particular calculations and analysis. Various adjustment options in accordance with your preferences.
Specifications:
Version: 7.0.3 |
Download
|

Similar Products:
MODULUSFE MODULUS STOCKCHARTX 5.8
Development :: Basic, VB, VB DotNet
 For .NET, VB6, C++ and other languages: StockChartX is a component that can import raw stock data, display it graphically, embed chart objects, and save/load in XML file format. Includes OHLC, Candlesticks, Renko, Kagi, Three Line Break, Point & Figure, Candlevolume, Equivolume, Shaded Equivolume, Darvas Boxes, plus over 150 technical analisys indicators, and line studies including Speed Lines, Gan Fans, Fibonacci and so much more!
Windows MAC Linux | Commercial
Read More
Development :: Basic, VB, VB DotNet
For .NET, VB6, C++ and other languages: StockChartX is a component that can import raw stock data, display it graphically, embed chart objects, and save/load in XML file format. Includes OHLC, Candlesticks, Renko, Kagi, Three Line Break, Point & Figure, Candlevolume, Equivolume, Shaded Equivolume, Darvas Boxes, plus over 150 technical analisys indicators, and line studies including Speed Lines, Gan Fans, Fibonacci and so much more!
Windows MAC Linux | Commercial
Read More
Business :: Accounting & Finance
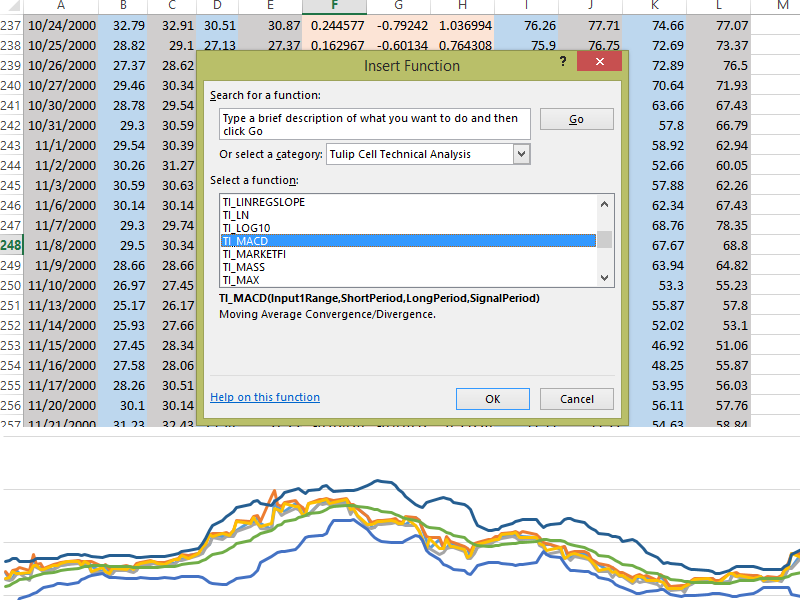 Tulip Cell is a Microsoft Excel add-in that provides over 100 technical analysis overlays and indicators. It provides indicators like moving average, MACD, Bollinger Bands, Stochastic, RSI, Parabolic SAR, and many more. Whether you're doing stock market, Forex, commodity market, or futures analysis, Tulip Cell is the best way to do technical analysis in Excel for free. Tulip Cell is completely free. The automated installer makes setup easy.
Windows | Freeware
Read More
Business :: Investment Tools
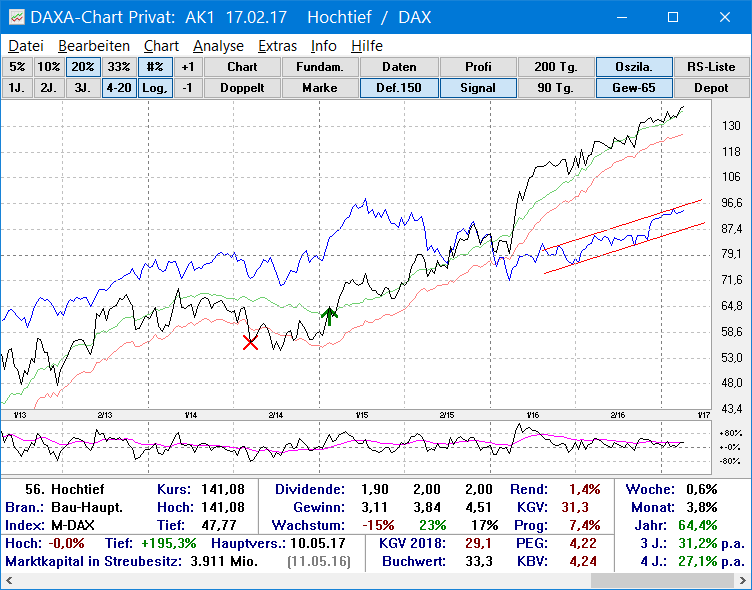 DAXA-Chart Privat is a freeware German program for analyzing and charting shares and portfolio management. Powerful yet easy to use, it is supplied with an initial database of 120 German stocks. Download further stockmarket price updates from our homepage for free.
Windows | Freeware
Read More